Article · Updated August 2026
The SaaS metrics worth checking each week

A weekly metric earns its place by changing a recurring decision. A number that is interesting, available or important at some other cadence does not automatically belong in the founder’s weekly view.
Build the set around the customer journey and one operating question per stage.
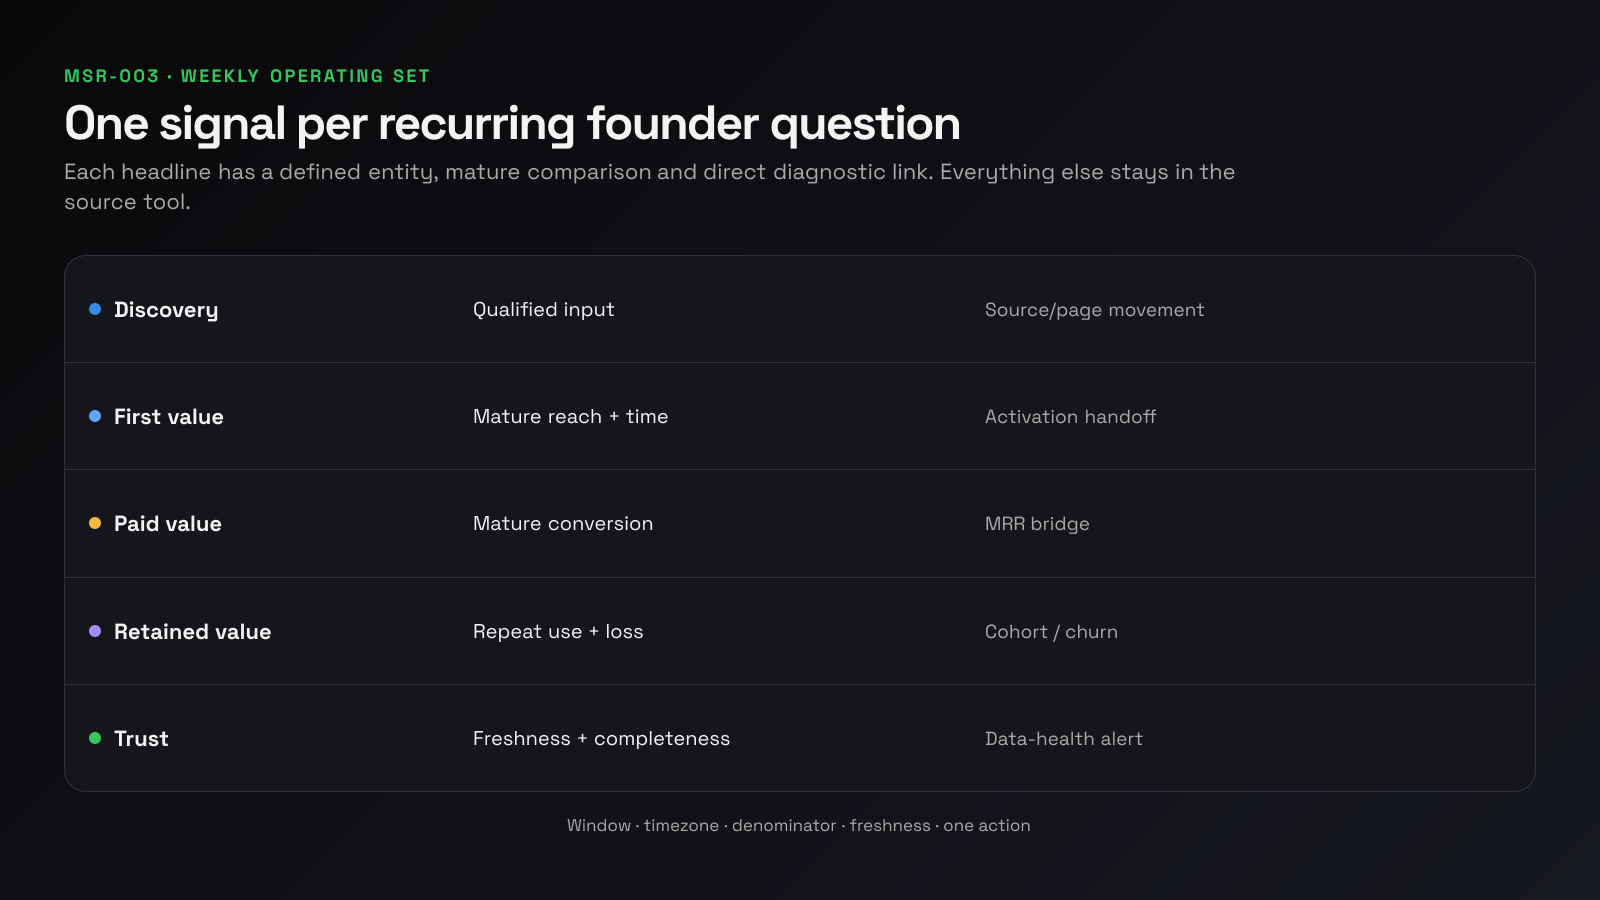
Start with five questions
- Is qualified discovery materially changing?
- Are eligible accounts reaching first value?
- Is first value becoming paid and recurring value?
- Are existing customers continuing to receive and pay for value?
- Are the source data current and comparable?
Each question gets one headline measure, one comparison and a link to the diagnostic source. This is an operating set, not the complete analytics model.
Use the customer journey as the schema
| Stage | Weekly headline | Denominator or bridge | Diagnostic link |
|---|---|---|---|
| Discovery | Qualified clicks, installs or leads | Eligible search exposure/channel population | Acquisition source |
| Arrival | Eligible new accounts | Qualified arrivals or installs | Landing/store/product entry |
| First value | Accounts reaching first value | Eligible accounts | Activation funnel |
| Paid value | Mature paid conversions or new MRR | Mature trial/eligible cohort | Billing/paywall source |
| Retained value | Retained accounts or net MRR movement | Starting cohort/MRR | Retention and revenue bridge |
| Trust | Source freshness and connection status | Expected source delay | Data-health view |
Choose the stage boundaries that reflect your business. An app may need store-page views, installs, first open, paywall and subscription. A sales-led SaaS may use qualified opportunity, activated workspace and paid account.
Define each measure before setting a target
For every metric, record:
- name and business question;
- event or financial definition;
- entity: device, user, account, subscription or customer;
- eligible population and exclusions;
- reporting window, timezone and cutoff;
- source and direct link;
- owner and expected freshness;
- comparison and action threshold;
- definition version.
“Activation rate” is not a definition. “Eligible new accounts that generated a first report within seven complete days of account creation” is.
Discovery: choose a qualified input
Raw sessions can grow while commercially relevant discovery is flat. Select the closest stable upstream signal:
- non-brand search clicks to intended landing pages;
- store product-page views or installs from a named market;
- qualified lead creation;
- new accounts from tracked campaigns;
- partner referrals meeting the qualification rule.
Pair the volume with a downstream handoff. If search clicks increase but eligible accounts do not, investigate page mix, measurement boundaries and conversion before celebrating traffic.
Do not force cross-channel attribution into one weekly percentage when the evidence is different by channel. Which channel actually drove the sale? provides the evidence hierarchy.
Activation: measure first value, not setup theatre
Use:
- eligible accounts entering the activation cohort;
- accounts reaching the defined first-value event;
- first-value reach rate;
- time-to-value distribution;
- largest absolute funnel loss when diagnosis is active.
Hide incomplete cohorts. If first value can take seven days, Friday’s cohort cannot be compared with a cohort that has had seven complete days.
Avoid adding every onboarding step to the weekly report. Find where your activation funnel leaks explains how to open the diagnostic once the operating signal moves.
Paid value: use mature conversion and an MRR bridge
For trial or freemium products, compare mature cohorts:
| Paid signal | Definition |
|---|---|
| Trial starts | Eligible accounts entering the trial |
| Mature trials | Trials whose conversion window is complete |
| Paid conversions | Mature trials reaching the stated paid state |
| Trial-to-paid rate | Paid conversions / mature trials |
| New MRR | Monthly-normalized recurring value from new subscriptions |
For revenue, show movement:
beginning MRR + new + expansion + reactivation − contraction − churn = ending MRR
The bridge answers more than an ending balance. Keep cash, proceeds and recognized revenue distinct from MRR.
Retained value: choose product and commercial retention deliberately
Product retention asks whether an entity repeated a valuable action. Subscription retention asks whether paid value remained. Keep both when they answer different questions.
Weekly options include:
- mature cohort repeated-value rate;
- weekly active accounts among the intended customer set;
- logo churn and contraction for a mature billing period;
- gross and net revenue retention when the window and starting base support them;
- at-risk recurring value from failed payments.
Do not compare exact-day app retention with weekly account retention. Why every tool reports a different retention rate supplies the definition worksheet.
Put data health beside performance
Every weekly value needs:
- last successful refresh;
- expected source delay;
- connection state;
- completeness or partial-period label;
- definition/version warning;
- known source discrepancy.
A 20% decline from a source that stopped refreshing is not a business insight. It is an incident.
A fictional weekly operating set
| Question | Current | Prior comparable | Interpretation |
|---|---|---|---|
| Organic discovery | 1,280 qualified clicks | 1,140 | Growth concentrated in two comparison pages |
| Eligible accounts | 174 | 168 | Nearly flat handoff despite more clicks |
| First value | 102 / 174 (58.6%) | 105 / 168 (62.5%) | Absolute first value fell; inspect source connection |
| Mature trial-to-paid | 28 / 71 (39.4%) | 31 / 75 (41.3%) | Within operating range; no action |
| Ending MRR | $18,420 | $17,690 | +$730 net; churn increased to $500 |
| Source health | 4 current, 1 partial | 5 current | Search comparison complete only through Friday |
These values are fictional. The action is to inspect the account-to-source-connection step for the mature activation cohort—not to add six more KPIs.
Decide what does not belong weekly
| Measure | Better cadence or role |
|---|---|
| Cash runway | Monthly close plus incident trigger |
| Full unit economics | Monthly/quarterly with stable allocation |
| Annual NRR | Monthly/quarterly cohort analysis |
| Session replay count | Diagnostic only |
| Every feature event | Source exploration |
| Search ranking for each keyword | SEO workflow, not founder brief |
| Support ticket details | Operational queue; summarize recurring pattern |
Cadence should match how quickly the evidence matures and the decision can change.
Set thresholds from your system
A threshold opens an investigation; it does not prove a cause.
Use:
- minimum absolute denominator;
- complete cohort requirement;
- change relative to comparable prior windows;
- normal operating range from your own series;
- material recurring-value exposure;
- source-health rules.
Avoid internet benchmarks copied across products with different markets, definitions and lifecycle timing.
Run the weekly review in 30 minutes
- Confirm window, timezone and source health.
- Read the five journey questions in order.
- Check mature cohorts and revenue arithmetic.
- Write two sentences: what changed and what remains uncertain.
- Choose one diagnostic and owner.
- Record the follow-up date.
A weekly founder report you can build in 30 minutes gives the full workflow. MetricsJar is intended to reduce the repeated cross-source assembly; source tools remain the place for detailed investigation.
Frequently asked questions
How many metrics should a founder check weekly?
Use the smallest set that answers the recurring operating questions. Five to eight defined signals can be enough; the correct number follows the decisions, not a rule.
Should MRR be checked every day?
Use alerts for billing incidents. Interpret MRR movement at a cadence where new, expansion, contraction and churn can be read together.
Is one north-star metric enough?
One health metric can focus attention, but guardrails and lifecycle diagnostics are still needed. Do not ask one number to explain the whole business.
What if our data volume is small?
Show counts, widen windows and avoid unstable percentage comparisons. Qualitative evidence can guide diagnosis while the cohort grows.
When should a new metric be added?
When a recurring decision cannot be made from the existing set and the new metric has a defined owner, source and action.
Sources
- Founder describing daily GA, Search Console, product and purchase checks
- A SaaS team tracking one customer-health metric
- Founder discussion about analytics tools and metrics
- Stop checking five dashboards every morning