Article · Updated August 2026
Why every tool reports a different retention rate
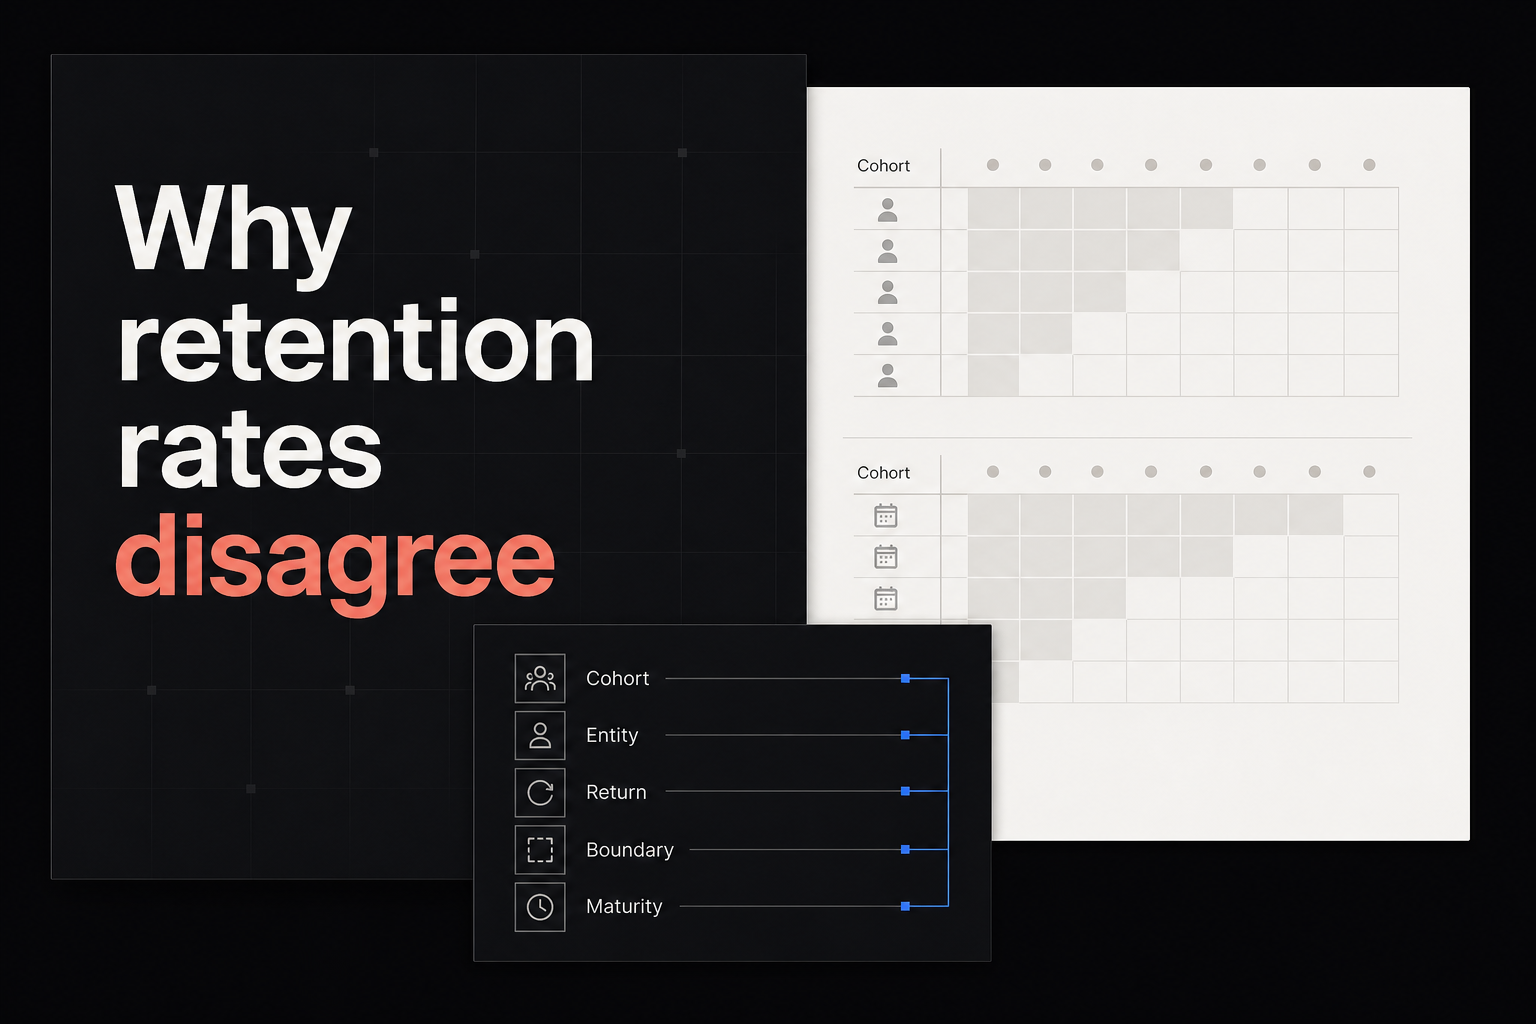
Two retention rates can differ because they retain different entities after different starting events on different time boundaries. App retention, product retention and subscription retention are not interchangeable.
Before comparing percentages, align five fields:
- cohort entry;
- entity;
- return event;
- time boundary;
- cohort maturity and exclusions.
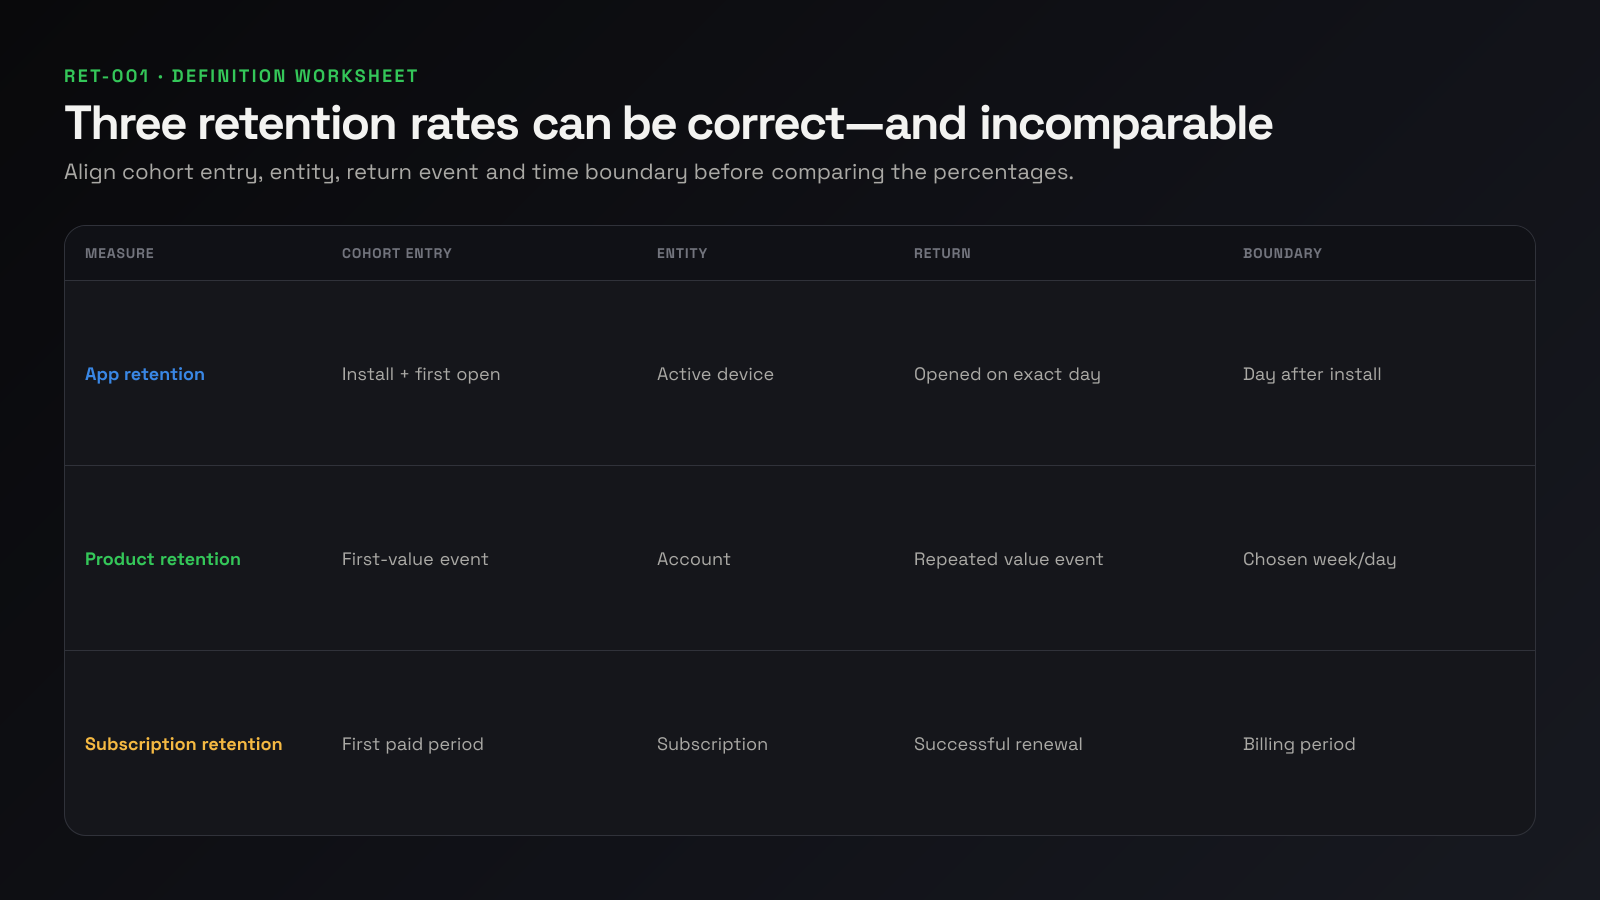
Three common retention measures
App retention
Apple defines app retention as the percentage of active devices that installed on a selected day and opened the app on a later exact day. Devices that install but never open do not qualify; usage is based on people who opted in to share analytics, and privacy thresholds can leave cells blank (Apple).
Entity: active device. Entry: install plus eventual first open. Return: open on an exact day after install.
Product retention
A product analytics tool may define a cohort from an account’s first-value event and retain it when the account repeats a chosen event in a later day or week. Depending on configuration, it can measure users, accounts or anonymous devices and use exact, rolling or unbounded return windows.
Entity and events are chosen by the team. That flexibility is useful and makes the label essential.
Subscription retention
RevenueCat’s subscription retention cohorts start with a paid subscription and measure successful renewal through later billing periods. It calculates relative to the original cohort members that had an opportunity to renew and excludes incomplete periods from its relative total (RevenueCat).
Entity: subscription. Entry: first paid standard period. Return: additional payment at the relevant subscription period.
Why the numbers differ
| Difference | Example effect |
|---|---|
| Device versus account versus subscription | One person can have two devices but one account and one subscription |
| Install versus first value versus first payment | Cohorts begin at different moments and sizes |
| Open versus value event versus renewal | The return requirement becomes progressively different |
| Exact day versus rolling/unbounded period | A return on day 8 may not count for exact D7 |
| Opt-in/privacy threshold | App Store usage can represent only eligible opted-in devices |
| Product duration | Monthly and annual subscriptions have different renewal opportunities |
| Grace, refund and resubscribe handling | Tools can classify the same lifecycle differently |
| Incomplete cohorts | Recent users have not had an opportunity to return or renew |
Build a retention definition sheet
For every chart, record:
| Field | App Store example | Product example | Subscription example |
|---|---|---|---|
| Display name | D7 app-open retention | Week-1 first-value retention | Month-1 subscription retention |
| Entry | Install cohort among devices that open | First dashboard_rendered | First paid standard period |
| Entity | Active device | Account | Subscription |
| Return | Open on day 7 | Render in following week | Successful renewal |
| Boundary | Source day after install | Reporting timezone/week | Product billing period |
| Exclusions | Non-opt-in and thresholded data | Internal/test accounts | Intro offers per chart method |
| Maturity | At least 7 days | Full later week | Had opportunity to renew |
Once named this way, the rates no longer “disagree.” They describe different retention.
A fictional reconciliation
Acme Coach sees:
- App Store Connect D7 app retention: 22%;
- product analytics D7 return: 54%;
- RevenueCat month-1 subscription retention: 81%.
These cannot be placed in one comparison column.
The App Store denominator is eligible active devices from the install cohort; product analytics uses identified accounts that completed signup; RevenueCat begins after first paid purchase. Every later denominator is more selected.
Create a bridge:
| Stage | Entity count | Selection |
|---|---|---|
| First-time downloads | 1,000 devices/downloads | Store acquisition |
| Accounts created | 620 accounts | Identity created |
| First value | 360 accounts | Product promise reached |
| First paid period | 90 subscriptions | Commercial cohort |
Then retain each stage on its own terms. Do not call 81% subscription retention evidence that 81% of installers remain.
Diagnose suspicious mismatches
Check the definition first
Find the vendor’s metric documentation and your saved chart configuration. Do not compare dashboard labels alone.
Check identity
Look for anonymous users becoming identified, account merges, test devices, reinstall behaviour, shared accounts and multiple subscriptions.
Check time
Align timezone, exact-day versus rolling periods, cohort start and maturity. A day-boundary mismatch can move returns between cells.
Check lifecycle rules
RevenueCat documents differences with App Store Connect around billing retry: RevenueCat can credit a later payment from the same subscriber/product as renewal, while App Store Connect may treat payments during billing retry or later as new subscriptions. That can change both starts and retention (RevenueCat).
Check environment and filters
Separate sandbox/test, app version, product, store, country and subscription duration. An unreleased app showing activity can indicate test or sandbox data rather than real customers.
Publish comparable measures
Use full names:
- D7 active-device app-open retention;
- Week-1 activated-account first-value retention;
- Month-1 paid-subscription renewal retention;
- Month-1 retained recurring revenue.
Include the cohort window, sample size and incomplete-period treatment. Link back to the source chart.
Reproduce a rate from event data
When the source permits export, reproduce one cohort before deciding the dashboard is wrong.
For exact D7 product retention:
- select accounts whose entry event occurred on the cohort date;
- exclude the documented internal/test accounts;
- apply the reporting timezone;
- count each eligible account once;
- count accounts with the return event on calendar day 7;
- divide retained accounts by the eligible cohort;
- leave a recent cohort incomplete until day 7 closes.
For weekly retention, define whether the following week is a calendar week, days 7–13, or any return after day 7. Those produce different rates.
Exact, classic and rolling retention
| Method | Question | Example |
|---|---|---|
| Exact | Did the entity return on this precise day/period? | Opened on day 7 |
| Classic period | Did the entity return within this named interval? | Repeated value in week 1 |
| Rolling | Did the entity return on or after the boundary? | Returned on day 7 or later |
Rolling retention will generally be at least as high as exact retention for the same event and cohort because it accepts more return times. Do not compare them under the same D7 label.
Customer, logo and revenue retention
SaaS teams also use “retention” for commercial measures:
| Measure | Numerator | Denominator | Can exceed 100%? |
|---|---|---|---|
| Customer retention | Customers remaining | Starting customer cohort | No |
| Gross revenue retention | Starting recurring revenue minus contraction/churn | Starting recurring revenue | No |
| Net revenue retention | Starting recurring revenue plus expansion minus contraction/churn | Starting recurring revenue | Yes |
Stripe notes that revenue retention can exceed 100% because expansion can increase the remaining MRR from a cohort (Stripe). That is not the same as more than 100% of customers being retained.
A step-by-step mismatch audit
When two charts disagree, fill this sequence without skipping ahead:
- Copy the full metric name and source URL.
- Record filters and date range.
- Record entry, entity, return and boundary.
- Record consent, privacy and test-data exclusions.
- Mark incomplete cells.
- Compare raw cohort sizes before rates.
- Reproduce one cohort from export where practical.
- Rename the measures if definitions differ.
- Escalate as a data defect only if identical definitions still produce unexplained results.
Raw cohort size is often the fastest clue. If Apple begins with 400 active devices and product analytics begins with 250 identified accounts, a percentage comparison cannot resolve the missing 150 entities.
Which measure belongs in the weekly report?
Choose the rate tied to the current constraint:
- acquisition quality: retained first-value accounts by source;
- product habit: repeated core-value event by account;
- subscription health: successful renewals by paid cohort;
- revenue durability: gross or net retained recurring revenue.
Keep the full name and definition visible. The founder report can show one rate and link to the other source views without declaring one tool the winner.
Frequently asked questions
Which retention rate is the correct one?
The rate whose definition matches the decision. Store engagement, product value and subscription renewal are separate jobs.
Why is product retention often higher than app retention?
It may begin from a more selected cohort, use identified accounts, allow a broader return window or track a different event. Check the definitions rather than assuming the tool is wrong.
Can I combine monthly and annual subscription retention?
Only with a method that respects different renewal opportunities. RevenueCat’s standard subscription-retention chart filters by product duration for this reason.
Should I use exact or rolling retention?
Use the boundary that matches product cadence and name it. Exact retention is useful for daily behaviour; rolling or period retention can fit less frequent jobs.
What should go in the founder report?
Choose the one retention measure tied to the current decision, show its full definition and keep other retention views in their source tools.
Sources
- Apple app retention definition
- RevenueCat subscription retention
- Stripe Billing analytics and retention definitions
- PostHog versus Apple D7 discussion
- RevenueCat versus App Store discussion
- Apple Analytics versus RevenueCat discussion