Article · Updated August 2026
A weekly founder report you can build in 30 minutes

A useful weekly founder report does not summarize the entire business. It aligns a small set of acquisition, activation, revenue and retention signals, then records the one decision or investigation that follows.
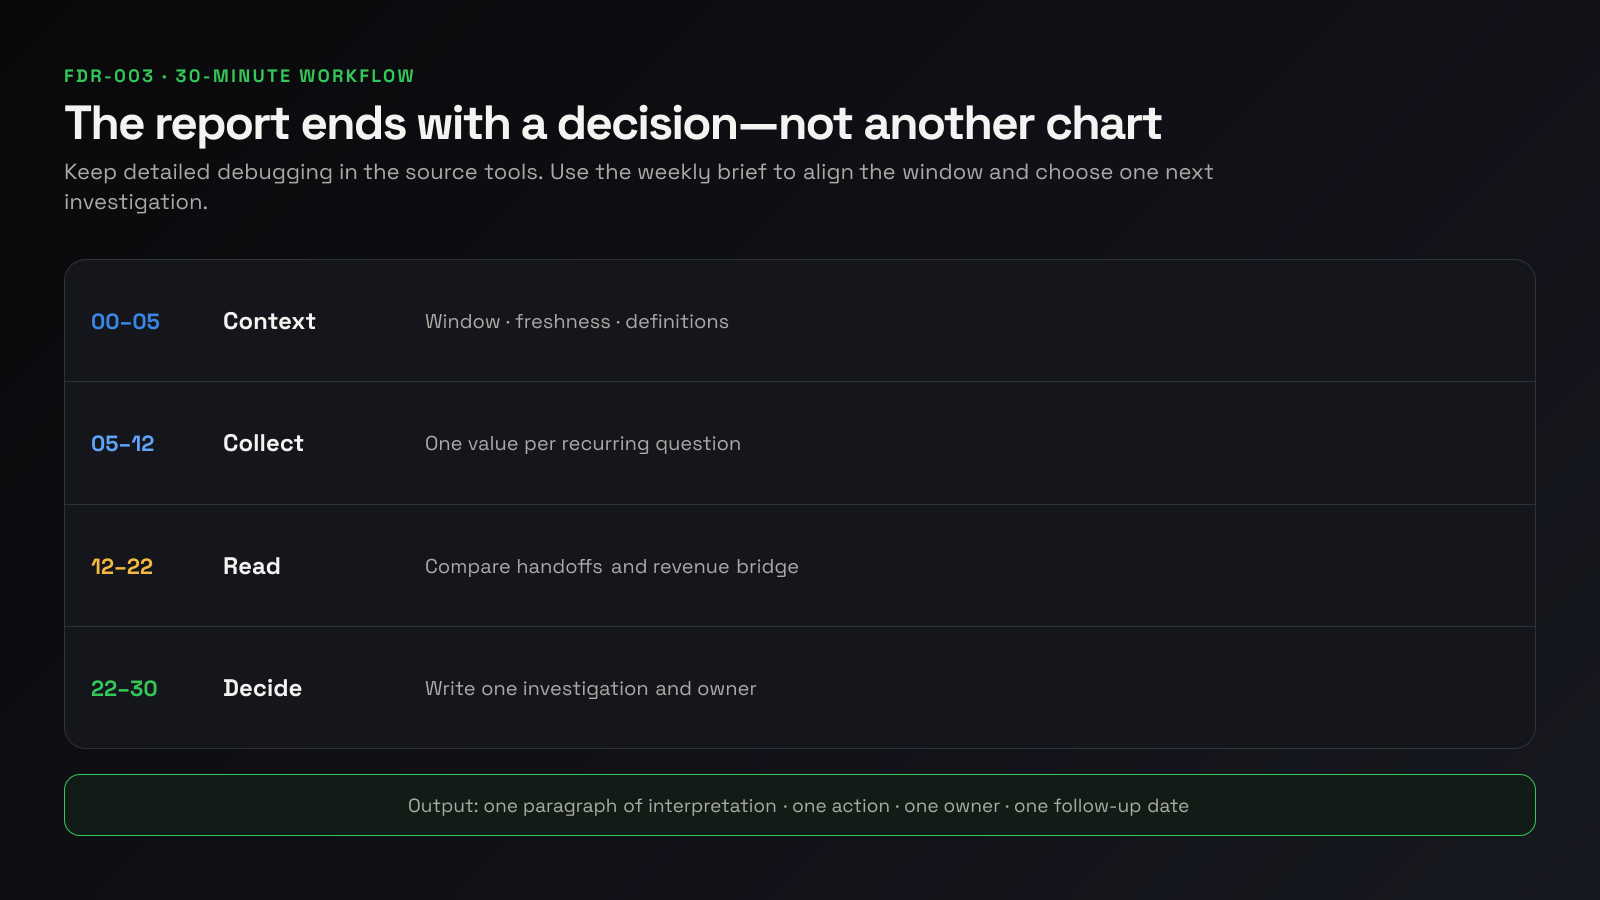
Build the first version in 30 minutes:
- 5 minutes: define the reporting context;
- 7 minutes: collect one number for each recurring question;
- 10 minutes: read the handoffs and revenue bridge;
- 8 minutes: choose one action, owner and follow-up date.
Before the clock starts
Have access to the existing source dashboards. Do not install a new stack during the exercise. Choose a weekly reporting day and one comparison convention, such as the last seven complete days versus the preceding seven complete days.
Write the five questions:
- Are more of the right people finding us?
- Do eligible new accounts reach first value?
- Does value become payment?
- Does acquired revenue stay?
- Which mismatch or movement deserves investigation?
Minutes 0–5: define context
At the top of the report, write:
| Field | Example |
|---|---|
| Project | Acme Notes |
| Window | 3–9 Aug 2026 |
| Comparison | 27 Jul–2 Aug 2026 |
| Reporting timezone | Australia/Sydney; source exceptions noted |
| Last refresh | 10 Aug 2026, 08:15 |
| Source health | Search delayed; product and billing current |
Do not begin interpretation before checking freshness. A missing day in one source can look like a product change.
Minutes 5–12: collect the minimum values
Use one metric per recurring decision.
| Question | Metric | Source | Unit |
|---|---|---|---|
| Are the right people finding us? | Search clicks or qualified sessions | Search Console or acquisition source | Click/session |
| Do they enter the product? | Eligible new accounts | Product database/analytics | Account |
| Do they reach value? | First-value completions and rate | Product events | Account |
| Does value become payment? | Mature paid conversions | Billing/subscription source | Customer/subscription |
| Does revenue stay? | Beginning and ending MRR with movements | Billing/subscription source | Normalized recurring revenue |
Copy the source value and link to its detailed report. Do not calculate a click-to-customer conversion unless the identity and attribution joins support it.
Minutes 12–22: read handoffs
Start with absolute values and the source unit:
| Stage | Current | Prior | Change | Confidence |
|---|---|---|---|---|
| Search clicks | 1,120 | 980 | +14.3% | Current through Friday only |
| Eligible new accounts | 142 | 136 | +4.4% | High |
| First-value accounts | 79 | 82 | −3.7% | High |
| Mature paid conversions | 18 | 17 | +5.9% | High |
| Ending MRR | $12,480 | $12,100 | +3.1% | High |
These fictional figures do not prove that search quality fell. They show that discovery rose faster than accounts and activation. The first investigation is the discovery-to-account and account-to-first-value handoff.
Then reconcile recurring revenue:
| Movement | Amount |
|---|---|
| Beginning MRR | $12,100 |
| New | +$780 |
| Expansion | +$160 |
| Contraction | −$90 |
| Churn | −$470 |
| Ending MRR | $12,480 |
The bridge prevents “we added $780” from being mistaken for $780 of net growth.
Minutes 22–30: write the decision
Use four lines:
Observed: Search clicks rose 14.3%, eligible new accounts rose 4.4%, and first-value completions fell 3.7%.
Does not prove: That search traffic quality or onboarding caused the divergence.
Investigate: Compare landing-page and source mix, then segment first-value completion by acquisition source where the account join is available.
Owner/follow-up: John; bring the segmented cohort to the 17 Aug review.
The report is finished when the next check is owned. It is not finished when every card is green.
Use a fixed one-page structure
- Reporting context and source health.
- Acquisition and product entry.
- First value and mature paid conversion.
- Revenue bridge and one retention signal.
- Interpretation, caveat, action and owner.
Detailed query, replay, transaction and cohort exploration stays in the source systems. Link out rather than reproducing every dimension.
Build the reusable template
Use the same worksheet every week:
Project:
Reporting window:
Comparison window:
Timezone and source exceptions:
Last refresh / source health:

Acquisition:
Product entry:
First value:
Mature paid conversion:
Revenue bridge:
Retention signal:

Observed:
Does not prove:
Investigate:
Owner and follow-up:
The “does not prove” line is important. It stops a correlation from hardening into a product story before anyone checks the handoff.
Read the report in a stable order
First check whether the report can be trusted. Then read from acquisition toward retained revenue.
1. Source health
If one source is incomplete, mark the affected cards and comparison. Do not carry forward last week’s value as if it were current.
2. Absolute loss
Percentage changes can make small stages look urgent. Record both the step conversion and the number of accounts lost.
3. Cohort maturity
Hide trial, retention and renewal outcomes that have not had enough time to occur. A recent cohort is incomplete, not underperforming.
4. Revenue movement
Reconcile beginning to ending recurring revenue. If it does not tie, the data-quality issue becomes the decision.
5. One broken handoff
Choose the handoff with the strongest combination of evidence, business impact and ability to investigate. Do not choose solely by the largest red percentage.
A second fictional example: when growth hides churn
Acme Forms reports 24 new paying customers, up from 17. Its founder might conclude that the week improved. The revenue bridge shows more:
| Movement | Current week | Prior week |
|---|---|---|
| New MRR | +$1,440 | +$1,020 |
| Expansion | +$180 | +$240 |
| Contraction | −$220 | −$90 |
| Churn | −$1,310 | −$480 |
| Net MRR movement | +$90 | +$690 |
New conversion improved, but churn absorbed most of the gain. The correct next action is not necessarily “find more customers.” It is to identify the churned cohort, separate voluntary from failed-payment loss and inspect whether one product, plan or acquisition source changed.
The report located the constraint. It did not diagnose why those customers left.
Make the report auditable
For every metric, keep a compact definition register:
| Display name | Source | Calculation | Entity | Freshness | Link |
|---|---|---|---|---|---|
| Activated accounts | Product events | First value / eligible accounts | Account | Near real time | Source funnel |
| Mature paid conversion | Subscription source | Paid / completed trials | Subscription | Store delayed | Trial cohort |
| Ending MRR | Billing source | Source configuration | Subscription/customer | Current | MRR chart |
When a definition changes, add the date and reason. A weekly report should reduce interpretation work, not create a parallel undocumented metric system.
Avoid common weekly-report failures
Changing definitions without a note
Version the first-value event, MRR configuration and exclusions. A metric break should not masquerade as a business break.
Comparing incomplete periods
Use complete weekly windows. Hide recent trials and retention periods that have not matured.
Writing a status diary
“Traffic up, MRR up” is not an operating brief. State the meaningful handoff and decision.
Carrying ten actions
Choose one primary investigation. Record other items in the normal product queue.
Automating before the brief stabilizes
Run the report manually for several weeks. Automate values that remain useful and definitions that remain stable.
When to automate
Automate when:
- the same questions recur;
- the source definitions are documented;
- date windows and timezones are explicit;
- someone checks freshness and failures;
- the saved assembly time exceeds the upkeep.
A spreadsheet, script, BI report or founder-reporting layer can all work. The best analytics stack for a small SaaS compares those options. MetricsJar fits when the sources exist and the repeated job is keeping this founder view alive.
Automate the collection first, not the conclusion. A generated report can bring the current values, comparisons, freshness and source links together. The founder still needs to decide whether the movement is meaningful and which diagnostic is worth running.
If an automated report takes longer than 30 minutes to validate, simplify the page or repair the source definitions before adding more cards.
Frequently asked questions
Can a useful report really be built in 30 minutes?
Yes, if the source metrics already exist and the goal is a first recurring brief. Instrumentation, identity repair or warehouse work is separate.
Should the report be daily or weekly?
Match the cadence to the decision and data maturity. Weekly is often enough for product and acquisition decisions; payment incidents may require alerts outside the report.
How many metrics belong on the page?
Use one per recurring founder question plus source health and the revenue bridge. Add another only when it changes a repeated decision.
Should I include charts or tables?
Use the representation that makes the decision easiest. A short comparison table and revenue bridge are often enough; charts help when trend shape matters.
What if a source is stale?
Mark it before interpretation and avoid comparing it with complete sources. Fix freshness as the first action when the missing data blocks the decision.
Sources
- Founder using Telegram bots for an overview
- Founder describing one less tool to check
- Solo founders comparing source dashboards