Article · Updated August 2026
How solo founders actually track their numbers: 200 conversations analysed

Solo founders do not have one analytics problem. They have a sequence of decisions spread across discovery, product use, payment and retention—and the evidence for each decision lives in a different place.
We reviewed 200 public Reddit and X discussions published in the first half of 2026. Every included record contains an actual decision, problem or operating choice about analytics. The corpus is useful for mapping the work founders describe in public. It is not a representative survey, and the counts below should not be read as market prevalence.
The clearest practical lesson is simple: start with the decision that is currently blocked, then collect the smallest trustworthy chain of evidence that can unblock it. A new dashboard is useful only when it shortens that path.
What we analysed
The final corpus contains:
| Property | Value | What it means |
|---|---|---|
| Eligible discussions | 200 | Every record passed the inclusion review |
| Reddit discussions | 57 | Public posts or comments with canonical URLs |
| X discussions | 143 | Public posts with canonical URLs |
| Publication window | 1 Jan–30 Jun 2026 | A bounded six-month observation period |
| Original cohort | 100 | Previously accepted records revalidated for this corpus |
| New cohort | 100 | Newly collected and reviewed records |
| Exact source text retained | 200 | The analysis can be traced back to what was actually written |
The new cohort began with 568 candidates whose publication dates and native records could be verified. Four blind adversarial reviewers agreed on 95 survivors; a fifth reviewer selected five more. The final validation checked that all 200 records had unique native IDs, canonical URLs, exact text and an identifiable decision.
That process reduces obvious noise. It does not turn public discussion into a population estimate. People who post publicly are self-selected, the platforms differ, and one conversation can touch several problems even though we assigned it to one primary article.
Six kinds of work appeared across the corpus
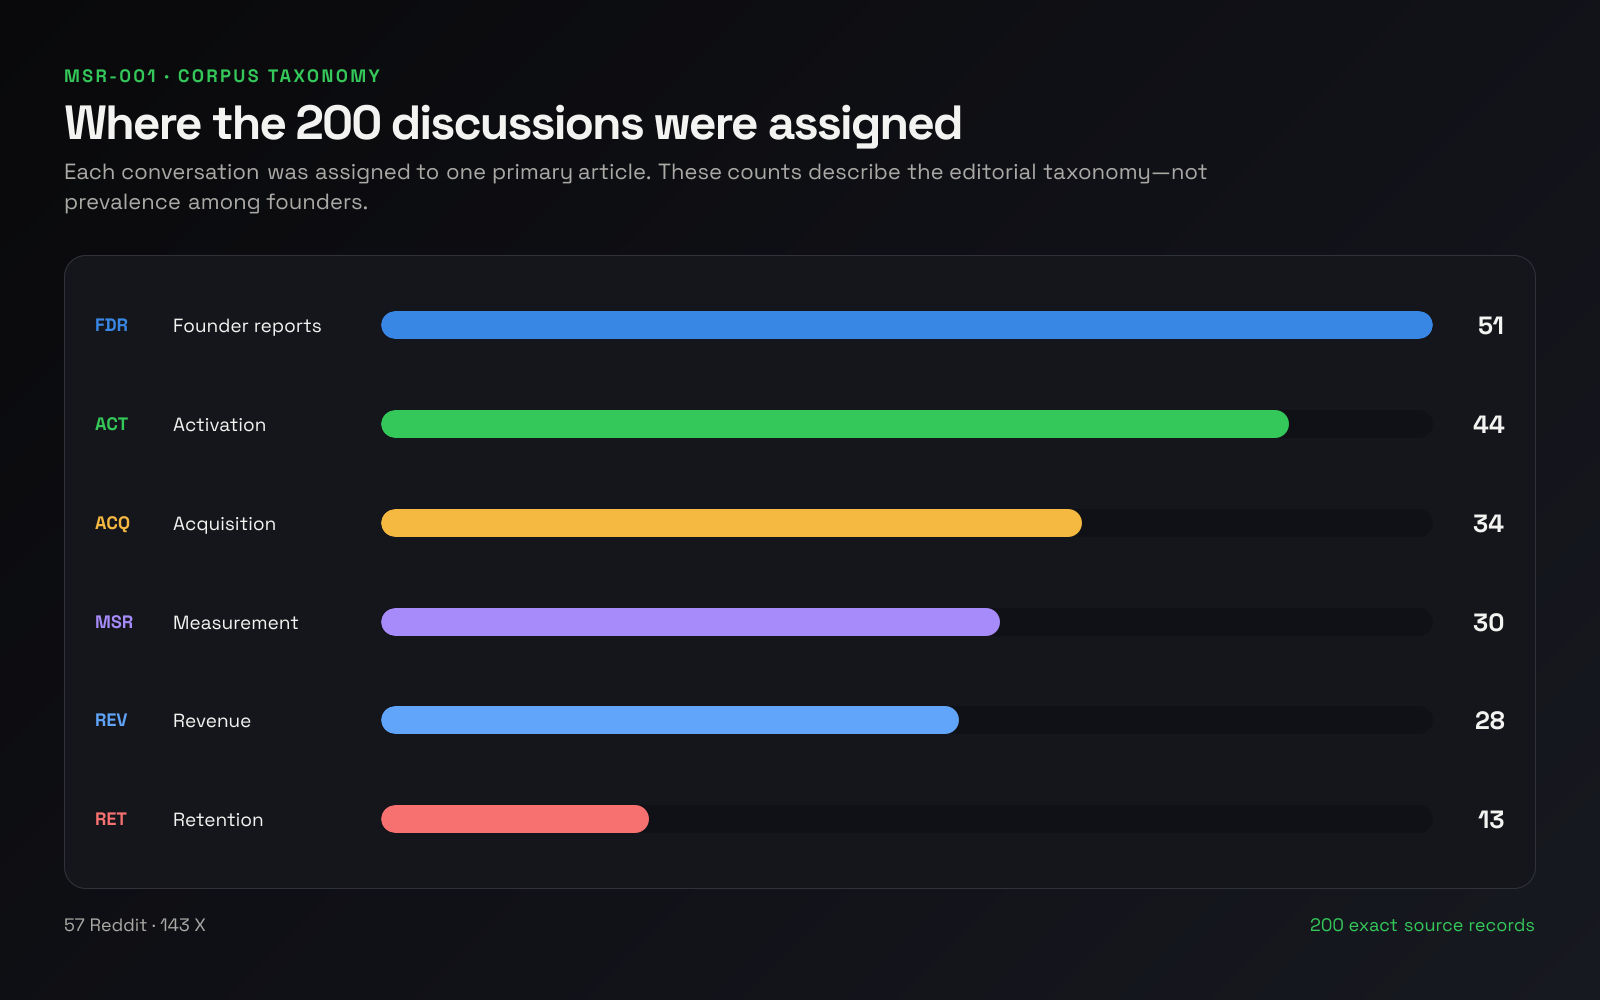
The 200 discussions were assigned to six editorial pillars so that each source supports one primary page. The allocation was:
| Code | Pillar | Assigned discussions | The founder question |
|---|---|---|---|
| FDR | Founder reports | 51 | What should I be able to see without rebuilding a report? |
| ACT | Activation | 44 | Where do new users fail to reach meaningful value? |
| ACQ | Acquisition | 34 | Which discovery or acquisition activity brought the right users? |
| MSR | Measurement | 30 | What should be instrumented, checked and trusted? |
| REV | Revenue | 28 | How do payment events become a coherent revenue picture? |
| RET | Retention | 13 | Who stayed, who left and why do the tools disagree? |
These are taxonomy counts, not findings such as “25.5% of founders need reports.” The assignment system deliberately gives every record one editorial home. Its purpose is to make the evidence auditable and the article programme navigable.
1. Founder reporting: keeping the recurring view alive
The reporting discussions are not all requests for a more elaborate dashboard. Many describe the work around the dashboard: opening several tools, aligning date ranges, copying numbers, checking whether they disagree and reconstructing the same brief next week.
One founder asked how many dashboards people actually check across Supabase, Stripe and PostHog. Another described checking Google Analytics, Search Console, product usage and purchases each day. A third showed Apple Search Ads, RevenueCat and Google Analytics in one view. Those examples support a practical distinction:
- source dashboards are where a metric is defined and debugged;
- a founder report is where a recurring cross-source decision is reviewed.
The report should not replace the source. It should make the next investigation obvious. Our practical guide to putting web, app and revenue metrics on one page begins with that boundary.
2. Activation: finding the first broken handoff
Activation discussions repeatedly connect top-line conversion with the need to inspect a specific step. A funnel can show where the count falls. It cannot tell you whether the fall is caused by product friction, missing events, identity loss, an immature cohort or a poorly chosen definition of value.
That is why the useful sequence is:
- define the eligible cohort;
- name the first-value event;
- confirm the event and identity joins;
- compare absolute loss as well as conversion rate;
- observe the affected step;
- change the product only after the measurement survives inspection.
The full method is in find where your activation funnel leaks. The important research signal is not that every founder needs a five-step funnel. It is that a top-line rate becomes useful when it leads to a concrete diagnostic.
3. Acquisition: preserving the route from discovery to revenue
Acquisition questions span several systems. Search Console can show a Google Search click. GA4 can show a session or event. App Store Connect can attribute a download to an App Store source or campaign. A billing source can show a transaction. None of those observations automatically shares an identity with the next one.
The practical job is to preserve the strongest evidence available at each handoff:
| Handoff | Useful evidence | Common break |
|---|---|---|
| Source → visit | UTM parameters, referrer, campaign ID, landing page | Redirects, privacy controls or direct traffic remove context |
| Visit → account | Anonymous ID joined to a stable account ID | Cross-device signup or identity reset |
| Account → purchase | Account/customer mapping and transaction ID | Store privacy boundaries or missing customer mapping |
| Purchase → retained revenue | Subscription state, renewal and cancellation events | Different revenue definitions or incomplete observation window |
When the join is absent, the honest result is “unknown,” not a stronger attribution model. The model can redistribute uncertainty; it cannot recreate evidence that was never collected.
4. Measurement: instrumenting enough to answer the question
Several discussions sit one layer below the dashboard: whether to add an SDK, which events to record, how to avoid tracking everything and how to keep analytics useful after the initial setup.
A small measurement plan can begin with four event families:
| Event family | Example | Why it exists |
|---|---|---|
| Entry | account created or app first opened | Defines the eligible cohort |
| First value | first report generated or first source connected | Measures the product promise being reached |
| Commercial | trial started, purchase completed, renewal failed | Connects product use to payment state |
| Return | meaningful action repeated after a time boundary | Supports retention analysis |
Record the entity, properties, trigger, exclusions and owner for each. Do not add an event because it might be interesting later. Add it because a recurring decision requires it.
5. Revenue: reconciling movement instead of reading one total
Revenue discussions include trial conversion, paywalls, multiple processors, app stores, failed payments and MRR calculations that do not match. Those are different problems joined by one principle: preserve the revenue basis.
Gross sales, proceeds, cash collected, recognized revenue and normalized MRR can all be correct while showing different amounts. A useful recurring-revenue view explains movement:
beginning MRR + new + expansion − contraction − churn = ending MRR
When the bridge does not reconcile, check the customer entity, currencies, refunds, plan intervals, event timing and failed-payment state before assuming the source is wrong.
6. Retention: defining the denominator before comparing rates
Retention disagreement often begins with a denominator mismatch. One tool may group installs by device, another may group subscription starts by customer, and a product tool may group identified accounts by first event. Their day boundaries and eligibility rules can differ as well.
Before comparing two retention rates, write down:
- the cohort-entry event;
- the entity being retained;
- the return event;
- the day or week boundary;
- exclusions and consent rules;
- whether the cohort is mature.
If those definitions differ, preserve both rates and rename them. Do not average them into a number that neither source owns.
How to choose what to fix first
Use the current blocked decision—not the loudest chart—as the selector.
| If you cannot answer… | Start with… | Stop when… |
|---|---|---|
| Are the right people finding us? | One discovery source and one downstream arrival signal | You can identify the first uncertain handoff |
| Do new users reach value? | Eligible cohort, first-value event and funnel | The largest trustworthy loss is visible |
| Does value become payment? | Mature trial/paywall cohort and transaction state | Conversion can be segmented without mixing incomplete cohorts |
| Does revenue stay? | Revenue bridge and retained cohort | New revenue and losses reconcile |
| Can I trust the weekly report? | Definitions, freshness and source links | Every displayed number has an owner and caveat |
Then choose the smallest stack that keeps that answer alive. The comparison in the best analytics stack for a small SaaS covers native dashboards, spreadsheets, internal reports, BI/product analytics and a thin founder-reporting layer.
What this research does not claim
This corpus does not tell us how common each problem is among all founders. It does not provide performance benchmarks, causal effects or vendor rankings. It does not prove that a problem mentioned often is more economically important than one mentioned rarely.
It does provide a reviewed index of 200 real public decisions, with direct source links, that can support diagnostic and comparison pages without inventing a founder consensus.
Frequently asked questions
Is this a survey of 200 founders?
No. It is an analysis of 200 eligible public discussions. A discussion can include more than one participant, and public posters are self-selected. Treat the corpus as decision evidence, not a representative sample.
Why include both Reddit and X?
The platforms expose different discussion shapes. Including both broadens the source material, while retaining the platform and canonical URL keeps the evidence auditable. It does not eliminate platform bias.
Were the six pillar counts discovered themes?
They are editorial assignments. Every discussion was assigned to one primary article so sources would not be counted repeatedly across the programme. The counts describe that taxonomy.
What should a solo founder measure first?
Measure the smallest chain required for the decision currently blocked. For many products that is eligible new accounts, a first-value event, a commercial event and a return event—plus source freshness and clear identities.
Does MetricsJar replace the source dashboards?
No. MetricsJar is intended to keep recurring cross-source signals visible while the source systems remain authoritative for their definitions and detailed investigation.
Sources
- Founder paying heavily for analytics without enough decision value
- Founder asked whether feature usage was tracked
- Discussion about the gap from insight to shipped fix
- Solo founders comparing the dashboards they check
- Daily Google Analytics, Search Console, product and purchase checks
- Combined Apple Search Ads, RevenueCat and Google Analytics dashboard