Article · Updated August 2026
Put web, app and revenue metrics on one page
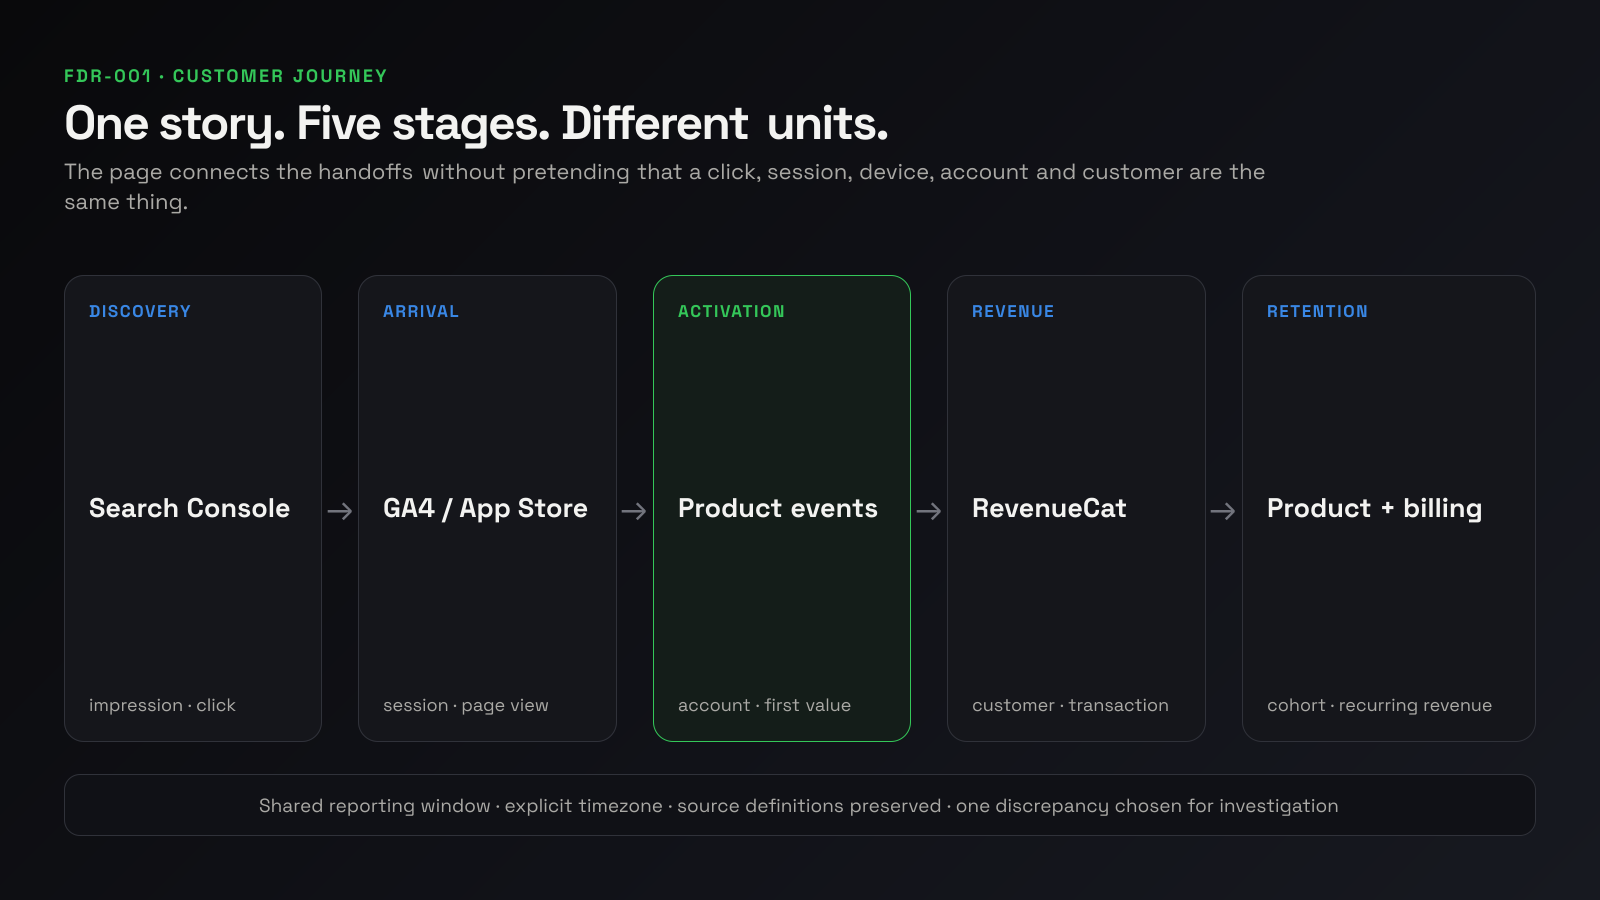
Putting web, app and revenue metrics on one page is useful only when the numbers share a reporting window and tell one continuous story. The page should connect discovery, product use and payment. It should not reproduce four source dashboards in miniature.
The first version needs to answer five questions:
- Are more of the right people finding the product?
- Do they reach the first meaningful value?
- Do trials or signups become paying customers?
- Does the revenue stay?
- Where does the story break between one source and the next?
If a metric does not support one of those decisions, leave it in its source dashboard.
Start with decisions, not charts
A one-page report is a decision surface. Before choosing chart types, write down the recurring question, the decision it changes and the source that owns the number.
| Founder question | Decision it supports | Useful metric | Source | Cadence |
|---|---|---|---|---|
| Are more of the right people finding us? | Keep, change or stop an acquisition effort | Search clicks by landing page or query group | Search Console | Weekly |
| Do new accounts reach value? | Investigate a product handoff | First-value completion rate and time to value | Product event source | Weekly |
| Does value become payment? | Review trial, pricing or paywall friction | Mature trial-to-paid conversion | Billing or subscription source | Weekly or monthly |
| Does acquired revenue stay? | Investigate churn or contraction | Beginning, new, expansion, contraction, churn and ending recurring revenue | Billing or subscription source | Monthly |
| Is the report trustworthy? | Fix data before changing the product | Freshness and connection state | Every connected source | Every review |
The source remains authoritative. The one-page view makes the sources easier to read together; it does not redefine them.
Preserve what each source actually counts
| Source | What it contributes | Unit to preserve | Important limitation |
|---|---|---|---|
| Search Console | Google Search impressions and clicks | Search appearance and click | Data is typically delayed by two to three days, uses Pacific Time for daily data and omits some rare queries for privacy (Google) |
| GA4 | Website or app behaviour and conversion events | User, session and event | A session is not a Search Console click; session counts are estimated and the default timeout is 30 minutes (Google) |
| App Store Connect | App discovery, product-page activity and downloads | Store-defined event, device or download | First-time downloads, redownloads and installations are different measures; usage data also depends on user opt-in (Apple) |
| RevenueCat | Subscription state and revenue movement | Customer, entitlement and transaction | Revenue, proceeds and normalized MRR answer different questions; MRR does not map directly to revenue (RevenueCat) |
Putting these numbers beside each other does not make them equivalent. A Search Console click can fail to become a GA4 session. An App Store download can be a redownload. A person can use more than one device. RevenueCat can normalize an annual subscription into MRR while the cash transaction occurs once.
Align four definitions before laying out the page
Every displayed metric needs four labels in the interface or its definition note:
- Reporting window. For example, 1–28 July, compared with the preceding 28 days.
- Timezone. Either keep the source timezone visible or document how the shared window was produced.
- Entity. Click, session, user, device, account, workspace, customer or transaction.
- Revenue basis. Gross sales, revenue after refunds, proceeds, cash collected or normalized recurring revenue.
A small worksheet prevents most silent disagreements:
| Display name | Source field | Entity | Calculation | Timezone | Freshness | Caveat |
|---|---|---|---|---|---|---|
| Search clicks | Search Console clicks | Click | Source value | Pacific Time | Usually 2–3 days | Not a website session |
| Website sessions | GA4 sessions | Session | Source value | Property setting | Source dependent | Estimated; session rules apply |
| First-time downloads | App Store Connect First Time Downloads | Download | Source value | Source setting | Source dependent | Excludes redownloads |
| Activation rate | Product first_value / eligible new accounts | Account | 98 / 160 | Product timezone | Near real time | Requires stable identity and event definition |
| Ending MRR | Billing-source MRR | Subscription/customer model | Source value | Source setting | Source dependent | Normalized recurring revenue, not cash |
Do not silently “fix” a mismatch by forcing one source to equal another. Preserve the values and explain the boundary.
Lay the page out in customer order
The page should read from context to acquisition, activation, revenue and retention. That order lets a founder follow a change rather than hunt for matching dates across tabs.
1. Reporting context
Show the project, reporting window, comparison window, last refresh and source health. A stale source should be visible before someone interprets a movement.
2. Acquisition
Put discovery and arrival together: search visibility and clicks, website sessions, or App Store product-page activity. These are adjacent signals, not necessarily a single funnel with one identity.
3. Activation
Show eligible new accounts, first-value completions, activation rate and median time to value. Keep onboarding completion separate unless onboarding completion is itself the value event.
4. Revenue
Show mature trial-to-paid conversion and a recurring-revenue bridge: beginning MRR, new, expansion, contraction, churn and ending MRR.
5. Retention
Use a cohort or recurring-revenue view to show whether acquired revenue stays. Do not use new sales alone as evidence of a healthier business.
6. Investigation
End with the one movement or discrepancy to check next. A dashboard that surfaces ten warnings without a next action has simply moved the tab problem onto one page.
On mobile, keep the same order in one column. Do not shrink a desktop grid until the labels become unreadable.
A worked example
The following figures are fictional. They show how to reconcile the page, not a benchmark.
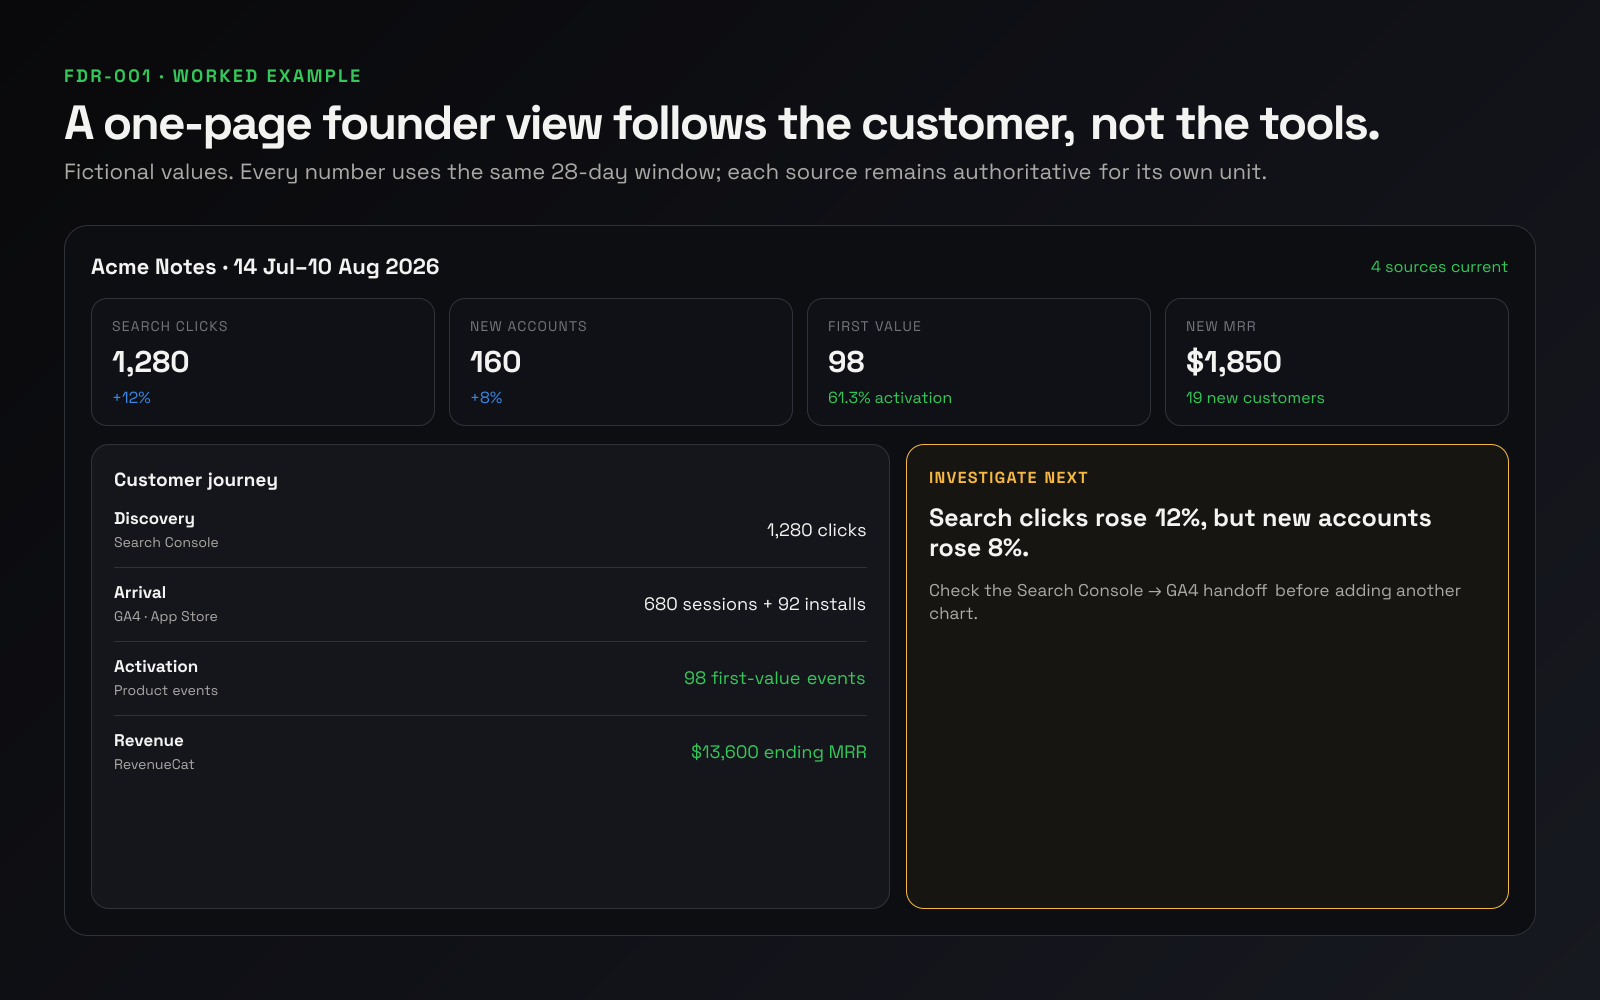
For 1–28 July, Acme Notes records:
| Stage | Metric | Value | Change from prior 28 days | What it answers |
|---|---|---|---|---|
| Search discovery | Search clicks | 1,280 | +12% | Is organic discovery growing? |
| Website arrival | Sessions | 680 | +4% | Is more website activity reaching the measured property? |
| App entry | First-time downloads | 92 | +15% | Are new app downloads increasing? |
| Product entry | New accounts | 160 | +8% | Are more people entering the product? |
| First value | Activated accounts | 98 | +2% | Do new accounts reach the chosen value event? |
| Paid conversion | New paying customers | 19 | −5% | Does first value become payment? |
| Revenue | Ending MRR | $13,600 | +5% | Did recurring revenue grow after losses? |
Do not calculate one conversion rate from 1,280 Search Console clicks to 160 accounts unless the product has a reliable shared identity and attribution method. The values can still be read together: discovery rose faster than new accounts, and new accounts rose faster than activation. That pattern tells the founder where to investigate; it does not identify a cause by itself.
The activation rate is 98 / 160 = 61.3%. The new-customer rate among activated accounts is 19 / 98 = 19.4%. The revenue bridge reconciles exactly:
| Revenue movement | Amount |
|---|---|
| Beginning MRR | $12,900 |
| New MRR | +$1,850 |
| Expansion MRR | +$320 |
| Contraction MRR | −$170 |
| Churned MRR | −$1,300 |
| Ending MRR | $13,600 |
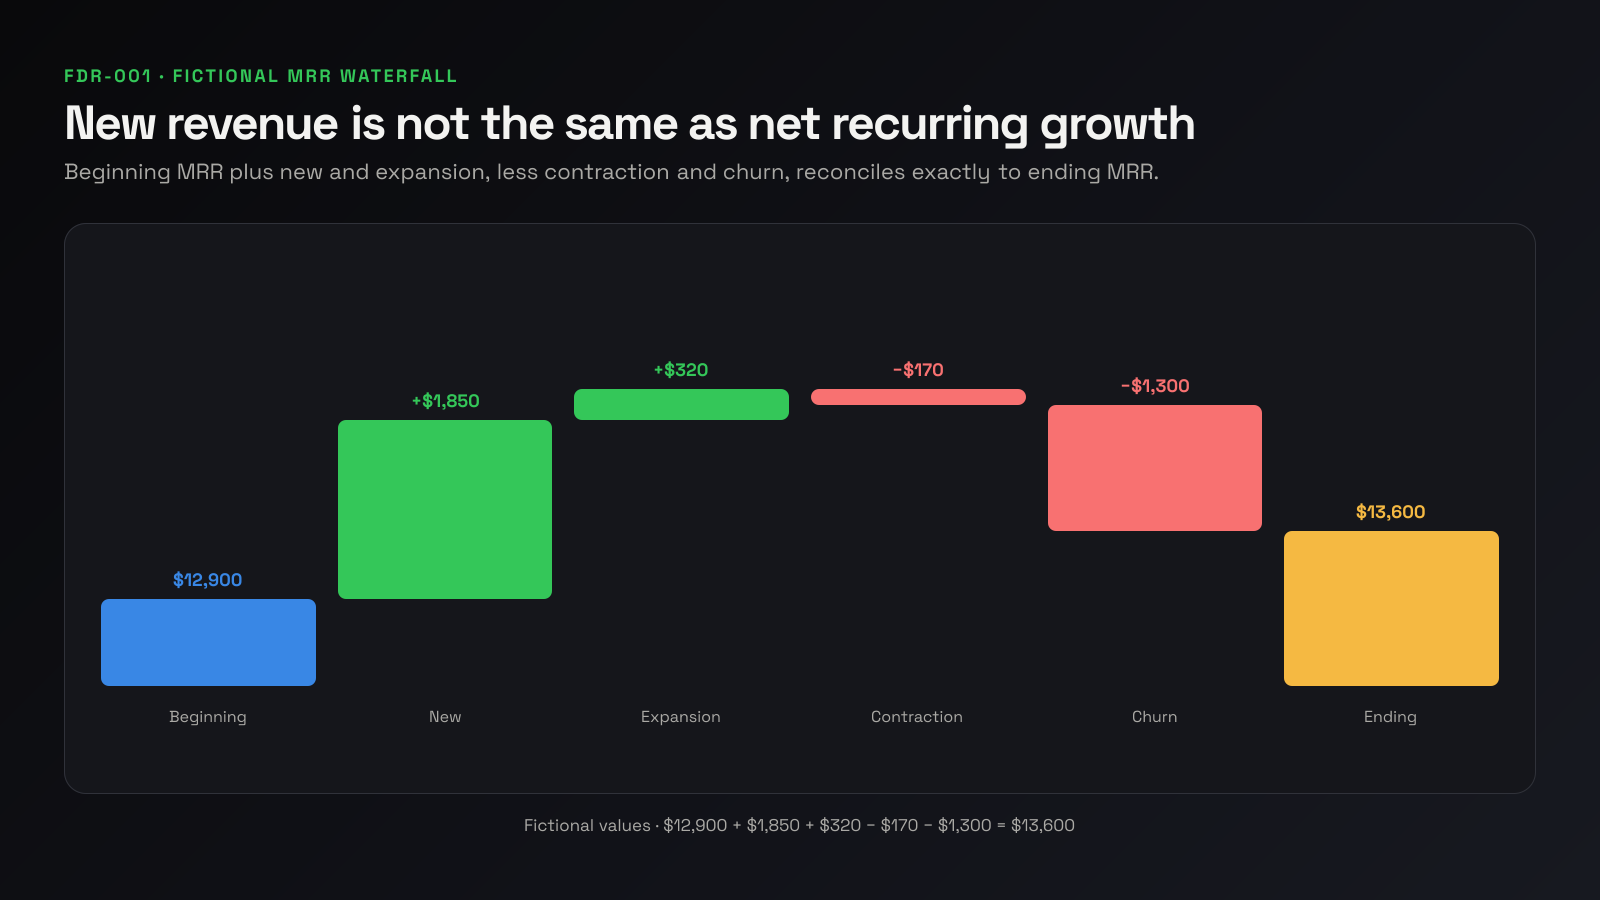
The bridge shows why “new revenue went up” and “ending recurring revenue barely moved” can both be true.
Read handoffs without claiming causation
| Pattern | What it can indicate | What it cannot prove |
|---|---|---|
| Visibility rises while downstream activity stays flat | Search mix, ranking position, intent, landing-page fit, tracking loss or a timing difference deserves review | That SEO traffic is low quality |
| Product-page activity rises while downloads stay flat | Store-page conversion, territory, device compatibility or campaign mix deserves review | That the screenshots or copy caused the drop |
| Signups rise while first-value completions stay flat | Onboarding friction, audience mix, event completeness or cohort maturity deserves review | That onboarding is the problem |
| Paid conversion rises while net revenue does not | Churn, contraction, refunds or plan mix may be absorbing new revenue | That the billing source is wrong |
| Acquisition improves while churn absorbs the gain | Retention may now be the binding constraint | Why customers churned |
Use “can indicate” deliberately. The page identifies the first sensible diagnostic; it does not replace it.
When two numbers disagree
Start with the least interpretive checks:
- Are the entities the same?
- Are the reporting window and timezone aligned?
- Are both sources fresh?
- Do identity or consent rules exclude different people?
- Does attribution assign the activity differently?
- Are the revenue definitions the same?
Only after those checks should you treat the mismatch as a product or acquisition signal. Keep the original source values visible while investigating.
Build the first version
Write the five questions. Choose one metric for each. Complete the definition worksheet. Lay out the page in customer order. Then review one full reporting period and select the first meaningful broken handoff.
You do not need a new warehouse or an exhaustive semantic layer to begin. You need a small, explicit view whose numbers can be traced back to their owners.
Frequently asked questions
Which metrics belong on the first version?
Only metrics that answer one of the five recurring founder questions or establish reporting trust. Start with one acquisition signal, one product-entry measure, one first-value measure, one paid-conversion measure, a recurring-revenue bridge and source freshness.
Should web and app conversion rates be combined?
Usually not unless both paths use the same eligible entity, value event and observation window. Put the rates beside each other with their definitions. Combine them only when the calculation remains meaningful after the merge.
Which timezone should the page use?
Choose one reporting convention for the page and disclose source exceptions. Search Console daily data uses Pacific Time, so an apparent one-day mismatch with another source can be a boundary issue rather than missing activity.
How often should the page refresh?
Refresh no faster than the decision requires and the slowest important source supports. A weekly founder review does not become more useful because one card updates every minute. Always show last-updated state.
What should stay in the source dashboard?
Detailed query, attribution, cohort, transaction and event debugging should stay with the authoritative source. The one-page view should reveal where to look next, then link back to the relevant source detail.
Sources
- Google Search Console performance report
- Google Search Console data differences and delay
- GA4 session definition
- App Store Connect metric definitions
- RevenueCat dashboard and metrics overview
- RevenueCat revenue chart definitions
- RevenueCat MRR and revenue index