Article · Updated August 2026
The best analytics stack for a small SaaS
The best analytics stack for a small SaaS is the smallest one that answers the decisions its team makes repeatedly. A larger stack is not better when the founder still reconciles dashboards by hand or maintains reports nobody uses.
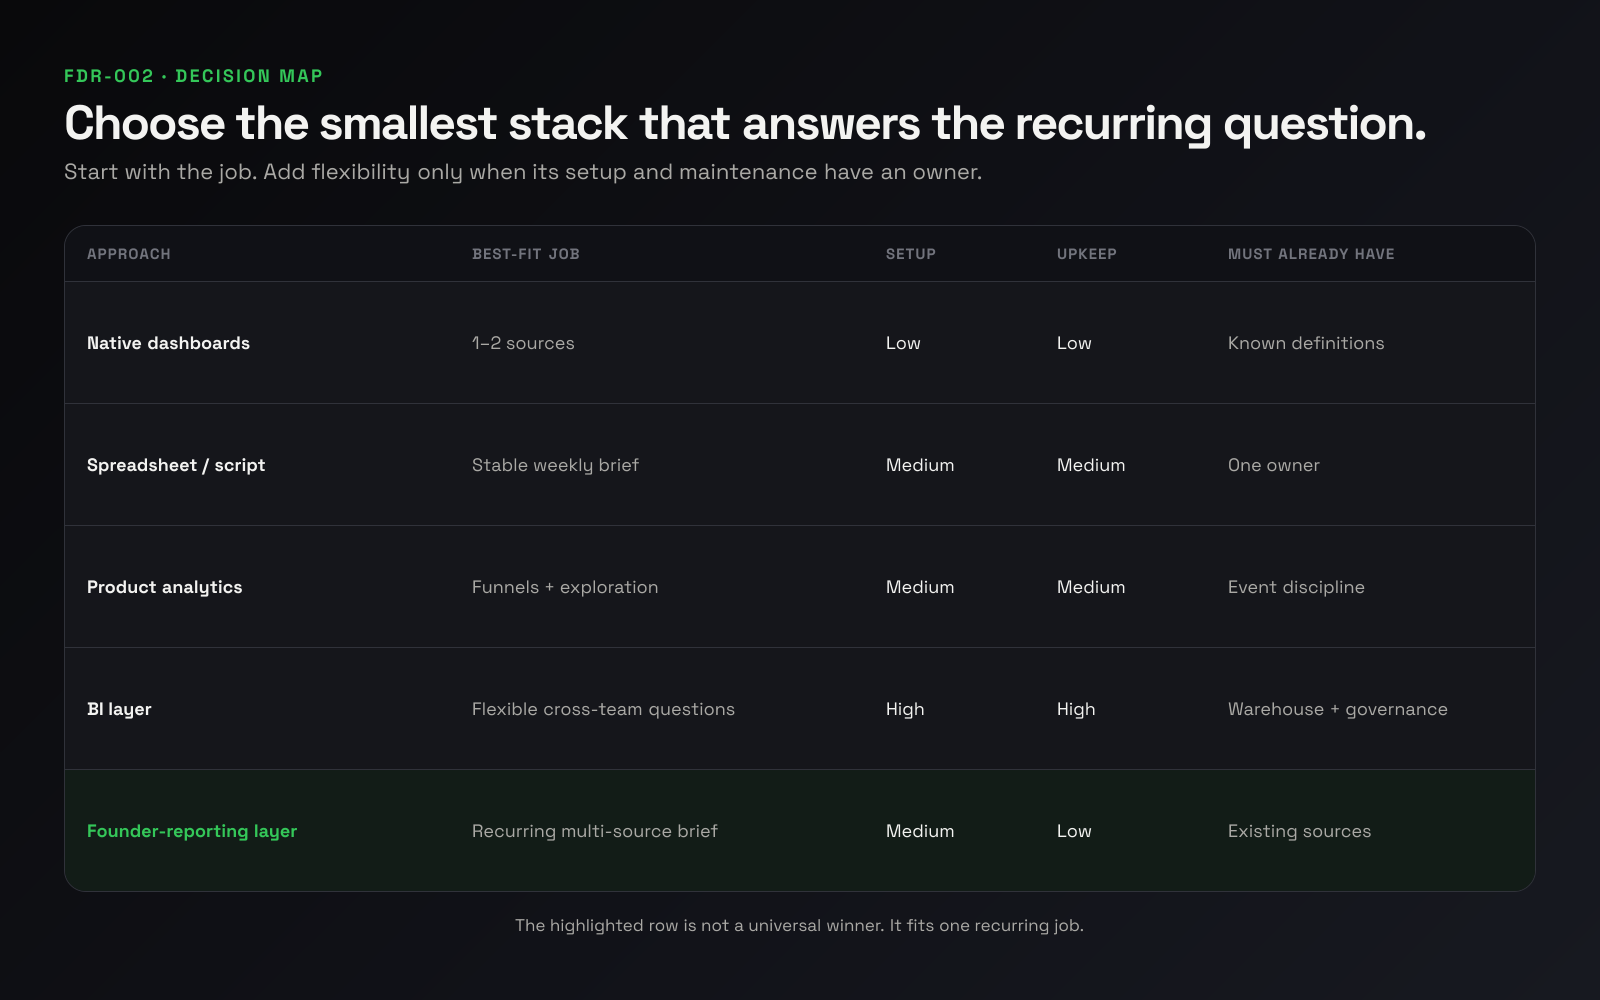
There are five credible approaches: stay in native dashboards, use a spreadsheet or recurring brief, build a small internal report, adopt a general BI or product-analytics tool, or use a thin hosted founder-reporting layer. The right answer depends on the job—not the longest feature list.
MetricsJar publishes this comparison and sells the fifth approach. That bias is explicit. The method and current vendor facts are published below, and MetricsJar does not win every row.
Define “best” before naming tools
Evaluate every option against the same questions:
- Which recurring decisions must it answer?
- Does the business need web-only, app-only or combined coverage?
- Which system remains authoritative for each number?
- What setup and technical prerequisites are required?
- How much weekly reconciliation remains?
- Who holds data and credentials?
- What is the current price basis?
- Who owns failures, definition changes and switching?
These criteria expose the real trade: flexibility, setup and maintenance usually move together.
Start with the minimum source layer
The reporting layer cannot replace the sources that create or own the underlying data. A small SaaS may need:
| Recurring decision | Minimum source | Optional source | Boundary |
|---|---|---|---|
| Is organic discovery improving? | Search Console | Rank tracking or keyword data | Search Console owns Google Search performance |
| Do visitors or users reach value? | GA4 or a product event source | Product analytics or replay | Event instrumentation and identity determine what can be measured |
| Are app installs and store conversion changing? | App Store Connect | Attribution or ASO tooling | Store-defined metrics remain authoritative |
| Are trials converting and subscriptions retaining? | Billing or subscription source | Revenue reporting layer | Transactions and entitlements stay with the billing system |
| Is the product failing operationally? | Error monitoring | Session replay | This is a different job from founder reporting |
An available integration is not automatically required. Add a source only when it answers a recurring question that the current stack cannot.
Five approaches compared
The prices and plan facts below were checked against primary vendor pages on 11 August 2026. They can change.
| Approach | Setup | Ongoing work | Data and credentials | Current price basis | Best fit | Poor fit | Switching cost |
|---|---|---|---|---|---|---|---|
| Native source dashboards | Low | Manual tab switching and reconciliation | Each vendor keeps its own data and access | Often already included with the source | One or two sources; occasional questions | Repeated cross-source review | Low |
| Spreadsheet or recurring script | Medium | Someone owns refreshes, schema changes and failures | Chosen by the builder | Spreadsheet may be no-cost; compute and APIs vary | Stable, narrow report with a technical owner | Authentication, hosting or many projects | Medium because logic becomes bespoke |
| Small internal dashboard | Medium to high | Hosting, auth, connectors and definitions | Controlled by the team | Infrastructure plus engineering time | Durable internal requirement and an owner | A founder who wants less software to maintain | High |
| General BI or product analytics | Medium to high | Instrumentation, modeling and governance | Vendor or self-hosted deployment | PostHog Product Analytics includes 1M events/month then usage pricing; Metabase has a free self-hosted edition and cloud plans | Exploration, segmentation and multiple question-askers | A fixed founder brief across external sources | Medium to high |
| Hosted founder-reporting layer | Low to medium | Connection health and definition review | Product-specific; verify before buying | MetricsJar: one complete dashboard free; unlimited hosted dashboards $40/month or $400/year | Existing sources, several projects, persistent founder views | Deep ad hoc analysis or one simple source | Medium |
Current product references: PostHog pricing, Metabase pricing, RevenueCat pricing, and Google’s no-cost Data Studio description.
When native dashboards are enough
Stay in native dashboards when you have one or two sources, know their definitions and do not repeatedly reconcile the same numbers. This is the lowest-maintenance answer.
For example, an app founder who checks App Store Connect for downloads and RevenueCat for subscription state once a week may not need another layer. The source interfaces are already available, and each is best placed to debug its own metric.
The warning sign is repetition: copying the same values into a note, re-aligning dates, or explaining the same mismatch each week.
When a spreadsheet or script is enough
A spreadsheet or recurring script fits when the report is stable, narrow and owned. It can be the best answer for a technical founder with two APIs and one monthly report.
Before choosing it, name the owner of:
- expired tokens and permissions;
- API or schema changes;
- timezone and currency rules;
- retries and stale data;
- hosting and access, if anyone else needs the report;
- changes to metric definitions.
If the honest owner is “future me,” include that maintenance in the decision. The spreadsheet is not free when it becomes a small internal product.
When product analytics earns its weight
Product analytics earns its place when the team needs to ask new behavioural questions, segment funnels and inspect paths—not merely read a fixed founder brief.
PostHog, for example, combines product analytics with adjacent tools and currently prices product analytics by event volume after a free allowance (PostHog). That can fit a team that wants product exploration and will instrument events carefully. It does not automatically solve Search Console, App Store and subscription reconciliation.
Add product analytics when exploration is a recurring job. Do not add it solely because “a SaaS should have analytics.”
When BI earns its weight
BI fits when several people need flexible questions across modeled data and the company can support the data layer underneath it.
Metabase offers a free open-source edition as well as hosted plans, while Google describes Data Studio as a no-cost reporting and visualization tool. Both can be strong choices. They still require a useful source model, connector choices and someone who owns the report.
Choose BI when flexibility is the point. It is usually excessive when the job is a stable weekly view for one founder.
When a thin founder-reporting layer fits
A thin layer fits when the source systems already exist and the repeated problem is keeping their top-line signals visible across projects. It should preserve source definitions, show freshness and reduce repeated setup.
MetricsJar is designed for that job. The free boundary is one complete hosted dashboard. Paid is for unlimited hosted dashboards at $40/month or $400/year. MetricsJar owns the rendered dashboard result and its authentication; connected provider credentials are encrypted and revocable. Private sharing is available through dashboard invitations.
This is a poor fit when the team needs unrestricted SQL, deep behavioural exploration or a bespoke internal semantic model. Use the tool built for that job.
A fictional small SaaS chooses
Acme Notes has a marketing website, an iOS app, GA4, Search Console, App Store Connect and RevenueCat. Its founder asks three questions every Monday:
- Did organic discovery become new accounts?
- Did new accounts reach first value?
- Did new revenue outpace churn?
| Approach | Can answer all three? | Source tabs still needed | Setup | Weekly work | Point where it stops fitting |
|---|---|---|---|---|---|
| Native dashboards | Yes, manually | All four | Low | High reconciliation | The same cross-source note is rebuilt weekly |
| Spreadsheet/script | Yes, with connectors and logic | Detail and debugging | Medium | Low to medium | Token, API and hosting work grows |
| Internal dashboard | Yes | Detail and debugging | High | Medium ownership | Founder becomes the dashboard maintainer |
| BI/product analytics | Yes after modeling and instrumentation | Store and billing detail may remain | Medium to high | Low to medium | The fixed brief does not justify the platform overhead |
| Founder-reporting layer | Yes if integrations cover the sources | Source debugging | Low to medium | Low | The team needs ad hoc analysis beyond the fixed view |
For Acme Notes, native dashboards remain correct if the weekly review takes minutes and the founder trusts it. A spreadsheet wins if the questions stay stable and the founder is happy owning the script. Product analytics wins if the next job is exploring behaviour by cohort. A founder-reporting layer wins if the job is keeping the same view alive without building another internal system.
Compare total operating cost, not just subscriptions
Vendor price and founder time are separate costs. Keep them separate unless you state an hourly assumption.
Record:
- initial setup time;
- weekly reporting time;
- maintenance events per quarter;
- hosting or API charges;
- subscription price and billing unit;
- cost of a stale or incorrect report.
A free tool that answers no recurring decision is still clutter. A paid tool that saves three clicks is not automatically valuable. The stack earns its place by improving a recurring decision at an acceptable operating cost.
Know when to stay where you are
Stay with native dashboards when they already answer the job. Keep the spreadsheet when its workflow is stable and maintenance is genuinely small. Keep BI when the team needs exploration more than a fixed founder brief. Build when there is a durable internal requirement and a real owner.
The correct recommendation can be the status quo.
Frequently asked questions
How many analytics tools does a small SaaS need?
As few as can answer its recurring acquisition, product and revenue decisions. Count distinct jobs, not categories on a “modern stack” diagram. Error monitoring and founder reporting can both be necessary because they answer different questions.
Is GA4 enough for a SaaS product?
GA4 can be enough for website or app behaviour when that is the only job. It is not a subscription ledger, App Store source or complete cross-source founder report. Use it for the decisions its event and identity model can support.
When should a founder add product analytics?
Add it when behavioural exploration, segmentation or repeated funnel analysis becomes a real job and the team will maintain the instrumentation. A fixed top-line report alone is a weak reason.
Should the stack include session replay and error tracking?
Only when they answer separate operational questions. Replay can help observe friction; error monitoring can reveal failures. Neither should be added merely to make the stack look complete.
Is it cheaper to build the dashboard?
Sometimes. Compare the subscription with explicit assumptions for build time, authentication, hosting, connector upkeep and definition changes. If those responsibilities are acceptable and durable, building can be correct.
Sources
- PostHog pricing
- Metabase plans and pricing
- Metabase license overview
- Google Data Studio product comparison
- RevenueCat pricing