Article · Updated August 2026
Why users churn: a practical diagnosis

“Users churn because they did not see value” may be true and still be useless. It combines several different failures—wrong fit, no first value, weak repeated value, billing trouble, product friction, support failure and changing circumstances—into one sentence.
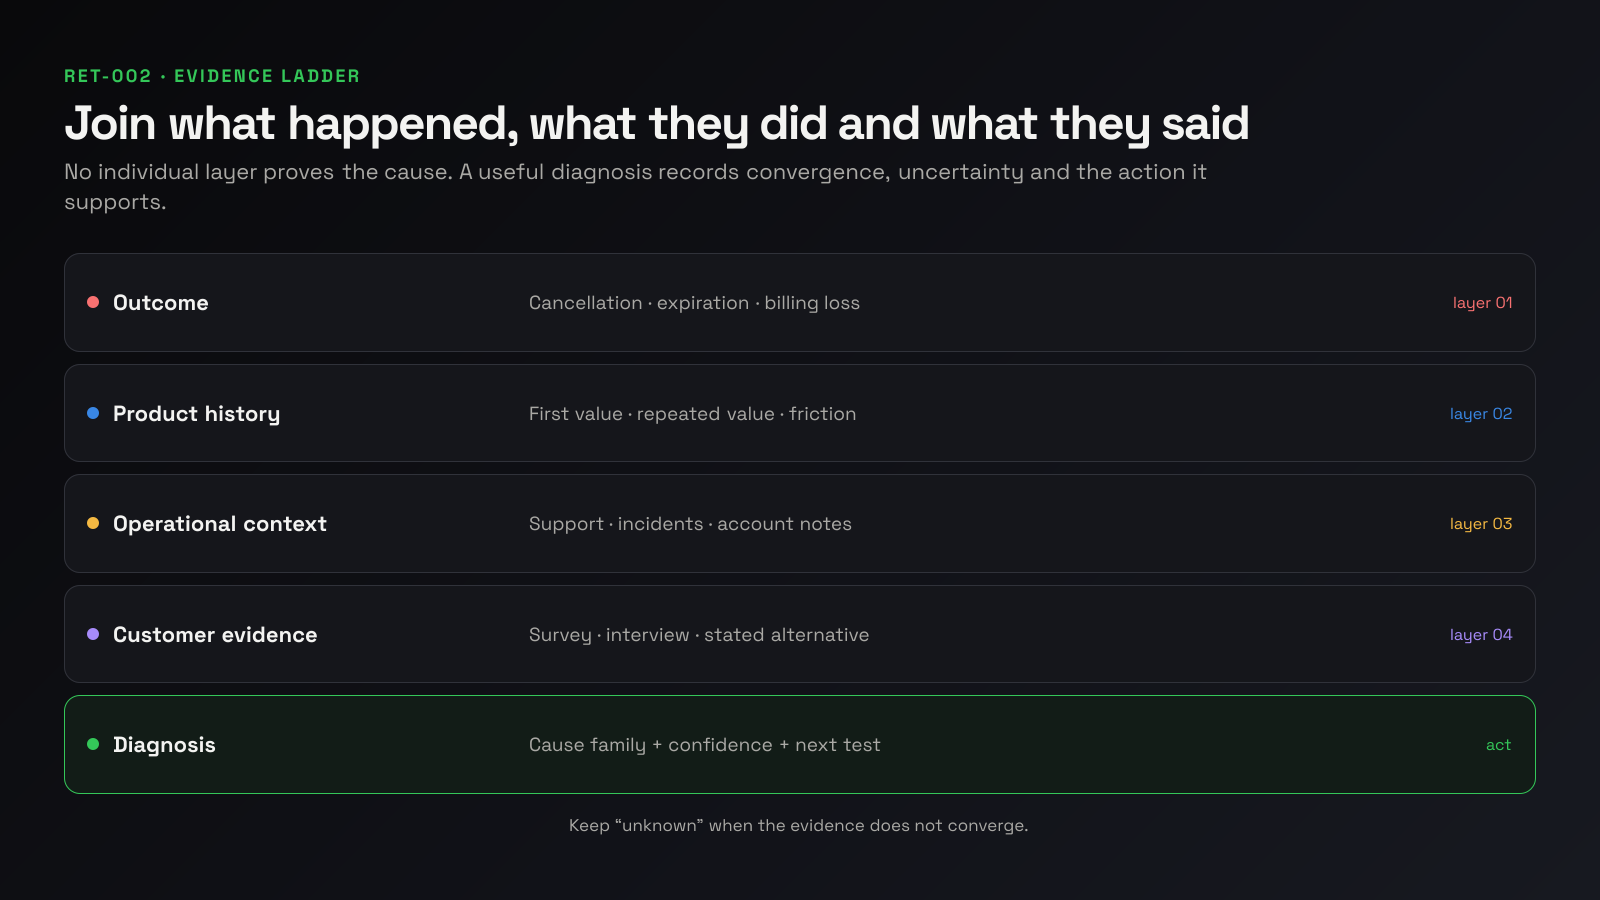
Diagnose a defined churn cohort by joining what happened, what the customer did and what the customer said. Keep observation separate from explanation.
Define the outcome before asking why
Separate:
| Outcome | Meaning |
|---|---|
| Voluntary cancellation | Customer disabled renewal or requested cancellation |
| Expiration | Paid access actually ended |
| Billing loss | Renewal failed and recovery did not succeed |
| Contraction | Recurring value fell while the account remained |
| Account deletion | Product account was deleted; billing state may differ |
| Inactivity | Product use stopped; subscription may remain active |
A customer who cancels annual renewal ten months before expiration is not the same diagnostic case as a failed monthly renewal. Find failed payments before they become churn handles billing loss separately.
Choose the unit: subscription, account or person. For B2B products, account-level churn can coexist with active individual users. Preserve both when useful.
Choose a mature cohort
Define:
- outcome window;
- observation cutoff;
- product and plan;
- acquisition or lifecycle segment;
- whether reactivations are netted;
- whether downgrades are separate;
- minimum history needed for behavioral analysis.
Do not analyse the latest incomplete period as if every eventual expiration has happened. Show counts beside percentages.
Build the churn evidence row
For each churned account, join only fields you can use lawfully and defensibly:
- subscription start, plan, interval and outcome;
- voluntary, billing or unknown classification;
- acquisition source when attributable;
- first-value event and time to value;
- repeated-value frequency;
- recent product events and errors;
- feature or workflow adoption;
- support conversations and unresolved issues;
- cancellation response or interview notes;
- customer segment and account age;
- evidence links and confidence.
Use stable account identifiers. Do not guess identity from email fragments or device characteristics.
Read the customer timeline
Create a compact sequence from entry to loss:
| Time | Evidence | Interpretation status |
|---|---|---|
| Day 0 | Signed up from comparison page | Observation |
| Day 1 | Connected billing source | Observation |
| Day 3 | Created first report | First-value definition met |
| Day 8–24 | Opened report twice | Low repeat use; interpretation pending |
| Day 19 | Asked support about missing app-store data | Observed friction |
| Day 31 | Cancelled; selected “missing integration” | Customer-reported reason |
| Day 35 | Access expired | Churn outcome |
The timeline supports “integration coverage contributed to this cancellation.” It does not prove every low-use account churns for the same reason.
Use four evidence layers
1. Subscription evidence
This establishes the outcome and financial exposure: cancellation, expiration, billing error, contraction, amount and timing.
2. Product behavior
This shows whether the account reached first value, repeated a valuable action, encountered errors or stopped using a workflow. Funnels locate the step; replay can explain selected sessions. Neither reveals intent on its own.
3. Operational context
Support, incident and account notes reveal unresolved bugs, missing integrations, migrations, procurement changes or service failures.
4. Direct customer evidence
Cancellation responses and interviews record the customer’s explanation. Treat forced-choice responses as signals, not perfect causal truth. “Too expensive” can mean budget loss, weak value, wrong plan or an easier alternative.
The strongest diagnosis occurs when layers converge.
Create a cause taxonomy without pretending certainty
Use categories that lead to different action:
| Cause family | Typical evidence | Possible response |
|---|---|---|
| Wrong fit | Never attempted core job; interview confirms mismatch | Tighten positioning/qualification |
| Failed activation | Eligible account did not reach first value | Fix setup path or assistance |
| Weak repeated value | Activated once, then stopped core workflow | Improve recurring trigger and output |
| Product friction | Errors, slow workflow, support issue | Repair named failure |
| Missing capability | Request tied to cancellation and observed workaround | Assess segment/product priority |
| Price/value | Direct evidence plus usage/value context | Revisit packaging, segment or value proof |
| Billing failure | Billing events and exhausted recovery | Improve revenue recovery |
| External change | Company closure, budget freeze, project ended | Record; avoid forced product fix |
| Unknown | Evidence does not converge | Keep unknown; seek more evidence |
Assign a primary cause only when evidence supports it. Add secondary factors and a confidence grade: confirmed, supported, tentative or unknown.
A fictional diagnosis
Thirty accounts expired in a mature monthly cohort.
| Diagnosis | Accounts | Lost MRR | Evidence quality |
|---|---|---|---|
| Failed activation | 8 | $420 | Supported by event history; 3 interviews |
| Weak repeated value | 6 | $510 | Behavioral pattern; 2 responses |
| Product friction | 4 | $360 | Error/support evidence |
| Missing integration | 3 | $440 | Direct responses and tickets |
| Billing loss | 4 | $250 | Provider events |
| External change | 2 | $310 | Directly confirmed |
| Unknown | 3 | $270 | Insufficient evidence |
| Total | 30 | $2,560 |
These fictional counts are not benchmarks. They demonstrate why both account count and MRR matter: three missing-integration losses expose more recurring value than eight activation losses in this cohort.
Compare with retained peers
A churn-only pattern can be misleading. Compare each group with similar retained accounts:
- same signup period and plan;
- similar acquisition source or intent;
- enough time to reach the milestone;
- comparable company/account type;
- same product and instrumentation version.
If 25% of churned accounts used a feature but only 5% of retained accounts did, the feature may be associated with friction—or it may simply be used by a difficult segment. Inspect the workflow and sample sessions before claiming cause.
Use absolute loss as well as rates. A tiny segment with a dramatic percentage may be less important than a common, moderate failure.
Interview from the timeline
Avoid “Why did you churn?” as the only question. Ask about the actual sequence:
- What were you trying to accomplish when you signed up?
- What did you expect to happen after setup?
- What was the first useful outcome, if any?
- When did the product stop being part of the workflow?
- What did you do instead?
- What made the final decision happen then?
- What would have needed to be different to continue?
Reference observed events carefully: “I can see the source connected, but the first report was not created. What happened next?” Do not make the interview feel like surveillance.
Record exact evidence sparingly, with consent and access controls. Summarize sensitive conversations rather than copying them into broad analytics systems.
Turn diagnosis into one test
Rank causes by:
- lost customers and MRR;
- confidence in evidence;
- ability to affect the cause;
- fit with the target customer;
- time to learn;
- risk of harming retained customers.
Then define one intervention and one outcome measure.
Example:
Finding: Eight churned accounts never reached first value; five stalled at source validation. Similar retained accounts usually completed validation within one day.
Change: Add an inline validation checklist and a direct error repair path.
Measure: Mature eligible-account first-value reach and median time to value, with validation-error rate as a diagnostic.
Guardrail: Successful connection rate and support contacts must not worsen.
Do not change onboarding, price and lifecycle email simultaneously; you will lose the ability to learn.
Build a recurring churn review
Every month:
- freeze a mature outcome cohort;
- separate voluntary, billing and contraction outcomes;
- join behavioral and support evidence;
- update direct feedback;
- classify with confidence;
- compare with retained peers;
- rank one diagnosis;
- assign one experiment;
- review prior interventions.
The founder report should show the movement, dominant supported diagnosis, unknown share and next test—not a wall of cancellation reasons.
MetricsJar can help place churn, revenue movement and product behavior in one reporting view. Source tools remain necessary for event detail, billing state, replay and customer conversations.
Common mistakes
- treating cancellation, expiration and billing loss as one event;
- analysing incomplete cohorts;
- using a cancellation dropdown as ground truth;
- reading replay without a defined question;
- ignoring retained-account comparison;
- forcing every case into a cause;
- reporting percentages without counts or MRR;
- inferring intent from behavior alone;
- fixing the loudest anecdote instead of the strongest supported pattern;
- collecting sensitive customer evidence without a clear purpose and access policy.
Frequently asked questions
How many churn interviews are enough?
There is no universal number. Continue until the current decision has adequate evidence, while showing the size and limits of the sample.
Should cancellation surveys be mandatory?
Avoid blocking cancellation. A short optional response can provide signal; interviews and observed history add context.
Can session replay tell me why someone left?
Replay can show what happened in a recorded session. It cannot by itself establish the customer’s reason or business context.
What if most churn is unknown?
Report unknown honestly. Improve identity joins, event definitions, support linkage and interview coverage before inventing a category.
Should we win back every churned customer?
No. Diagnose fit first. Some churn reflects a customer or use case the product should not optimize around.
Sources
- A founder investigating churn after MRR fell
- Joining churned-user lists with product data
- Watching recordings from uninstalling users
- What happened after a founder stopped ignoring churn
- Session replays or funnels: which explains the drop-off?
- Why every tool reports a different retention rate