Article · Updated August 2026
Measure time to value, not onboarding completion
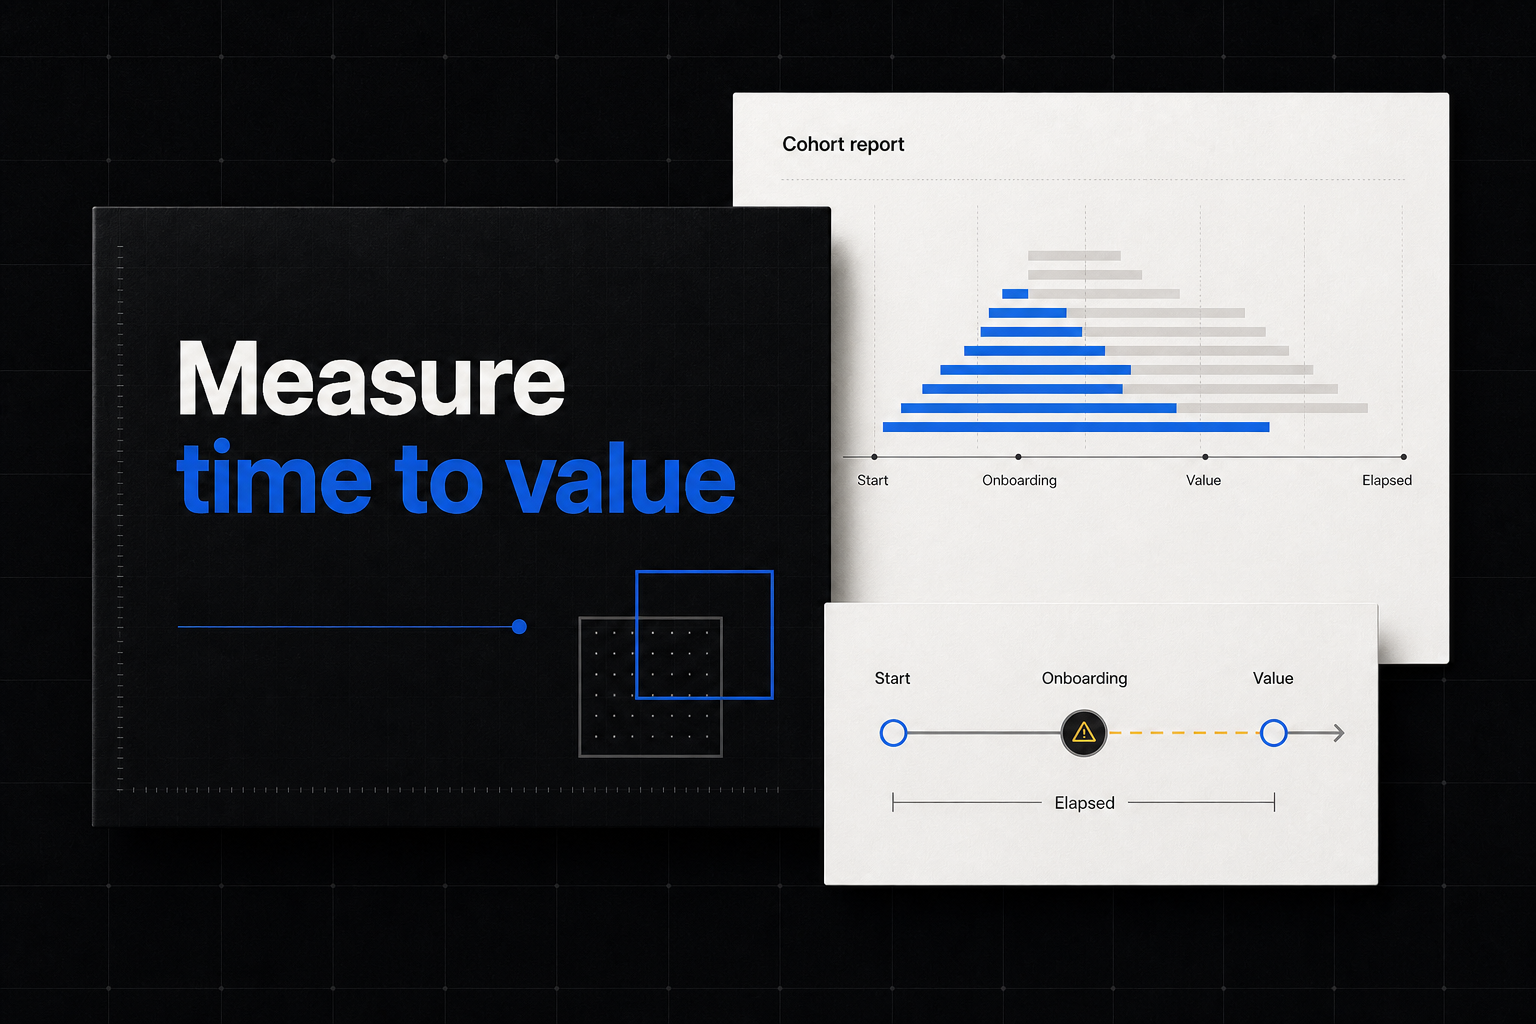
Onboarding completion measures whether someone finished the steps you designed. Time to value measures whether—and how quickly—an eligible account received the outcome they came for.
Report both first-value reach and elapsed-time distribution. A median among successful accounts can hide everyone who never reached value.
Define first value
Complete this sentence:
An eligible account has received first value when ______.
Good definitions describe a completed outcome:
- a usable report renders from connected data;
- an invoice is delivered successfully;
- a workout is completed;
- an automation runs successfully;
- a collaborator receives the shared result.
“Viewed dashboard,” “finished tutorial” and “clicked generate” may be steps, not value.
Define the clock
| Field | Example |
|---|---|
| Eligible start | Account created with the required product type |
| Value end | First complete current dashboard rendered |
| Entity | Account |
| Clock | Event timestamps in one standard timezone |
| Maximum window | Seven days |
| Exclusions | Internal, sandbox, migrated accounts |
| Censoring | Recent accounts remain incomplete until window closes |
Choose a start that the account controls or that fairly begins the journey. If value requires an invited colleague or an external data delay, record that dependency separately.
Use one clock per journey. An invited member, workspace owner and anonymous app user may need separate definitions. Mixing them creates impossible durations and ambiguous eligibility.
Calculate reach and time
first-value reach = accounts reaching value / eligible mature accounts
time to value = first value timestamp − eligible start timestamp
Report:
- eligible mature accounts;
- accounts reaching value;
- reach rate;
- median and selected percentiles among those reaching value;
- distribution buckets;
- accounts not reaching value within the window.
Do not report only the mean; long delays can distort it. Do not report only the median; non-activation disappears from that statistic.
For incomplete recent accounts, do not label the outcome failed. Either wait for the maximum window or use a method that explicitly handles censored observations. A simple founder report can hide the newest cohort until mature.
A fictional example
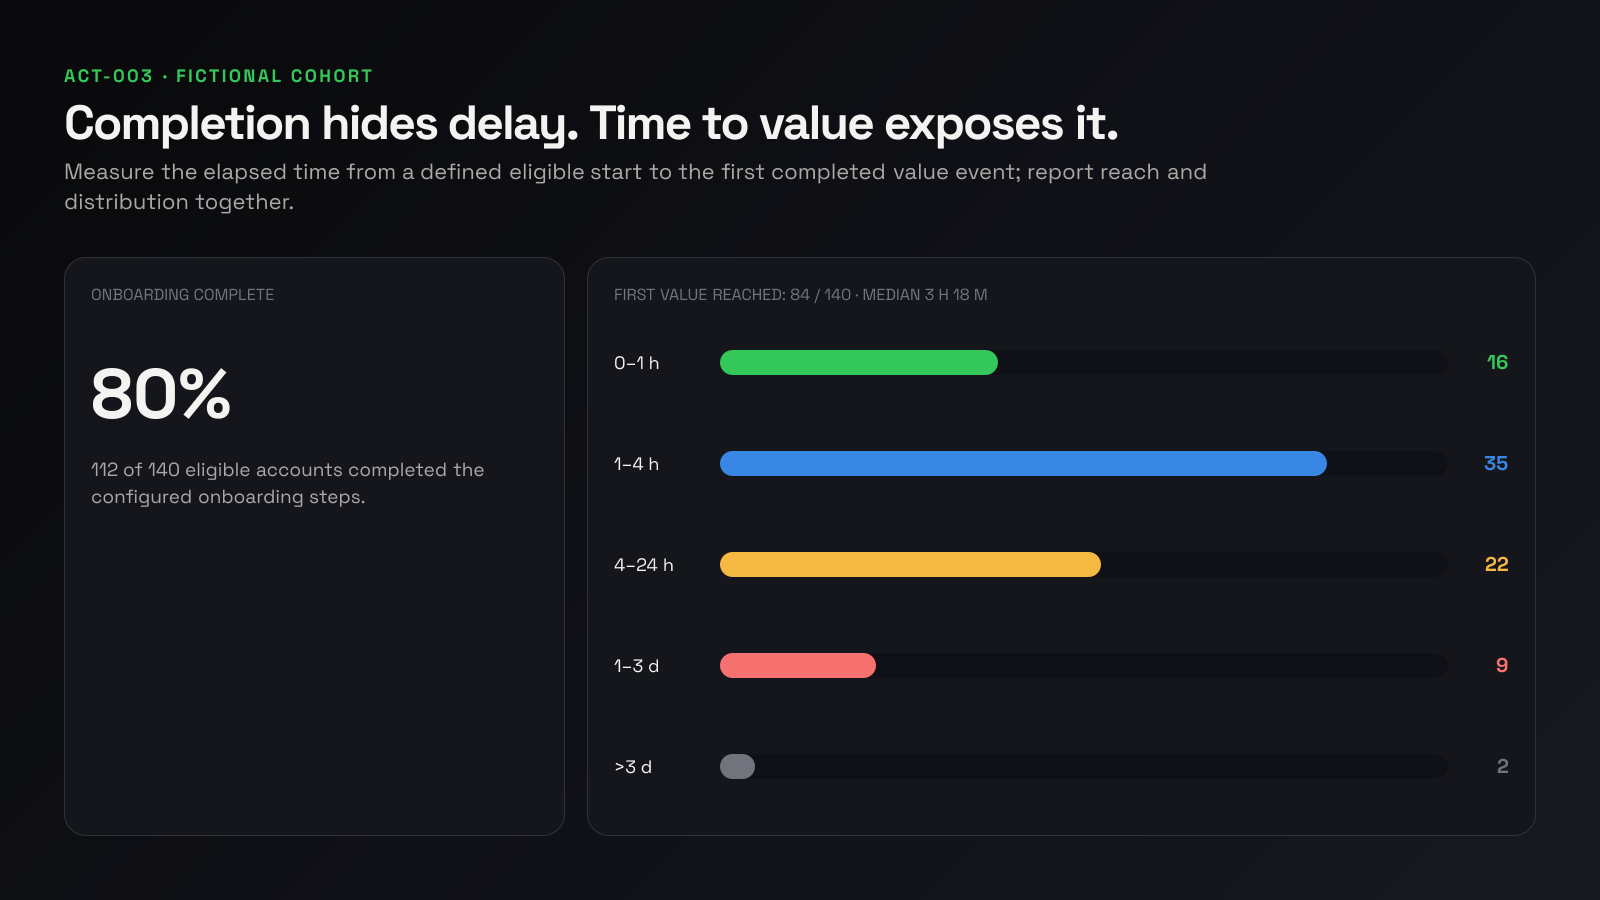
Among 140 mature eligible accounts:
- 112 complete onboarding (80%);
- 84 reach first value (60%);
- median time among those 84 is 3h18m;
- 16 reach value within one hour;
- 35 in one to four hours;
- 22 in four to 24 hours;
- 9 in one to three days;
- 2 after three days;
- 56 do not reach value within seven days.
The 80% onboarding rate hides 28 accounts that completed the flow but did not reach value. The next diagnostic is the handoff after onboarding, not the onboarding completion screen.
Decompose elapsed time
| Segment | Start | End | Owner |
|---|---|---|---|
| Account setup | Account created | Required details complete | Product |
| Source connection | Connection starts | Usable data confirmed | Product/integration |
| Processing wait | Data confirmed | Report ready | System/source |
| Value discovery | Report ready | First useful report viewed/exported | Product/customer |
For each segment, record elapsed time and failure state. The longest median segment may not be the best target if it is externally constrained; combine impact and ability to change.
Add the percentage of eligible accounts entering and completing each segment. A fast segment among ten successful accounts can coexist with 100 accounts that never entered it.
| Segment | Entered | Completed | Median elapsed | Primary loss |
|---|---|---|---|---|
| Account setup | 140 | 112 | 8 min | 28 |
| Source connection | 112 | 91 | 52 min | 21 |
| Processing | 91 | 86 | 1h14m | 5 |
| Useful report viewed | 86 | 84 | 12 min | 2 |
These fictional values show that setup causes the largest absolute loss, while processing consumes the most elapsed time among completers. Those are two different improvement opportunities.
Compare cohorts fairly
Segment by dimensions chosen before interpretation:
- acquisition source;
- platform/device;
- product or plan;
- source/integration type;
- app version;
- experiment variant.
Keep sample sizes visible. A dramatic median from five accounts is a lead, not a finding. Hide recent accounts whose maximum window has not elapsed.
Use percentiles when volume supports them:
- median: typical successful account;
- 75th percentile: slower but common path;
- 90th percentile: tail experience;
- reach rate: everyone who never received a duration.
Do not compare percentiles across cohorts whose eligibility or value event changed.
Diagnose common patterns
High onboarding completion, low value reach
The checklist is not the value path, or a post-onboarding dependency fails.
Good reach, long tail
Most accounts succeed, but a segment experiences delays. Compare integration, platform and error state.
Fast value, weak retention
First value may be too shallow, or recurring value may not follow. Time to value is not a retention guarantee.
Low reach and short successful median
The success path is fast for those who make it; many never enter or complete it. Diagnose eligibility, intent and the first loss.
Improve the metric without gaming it
Do not move the first-value event earlier merely to reduce time. Keep the product promise stable. Remove unnecessary waits, prefill known data, surface errors, allow safe deferral of nonessential setup and make the next action clear.
After a change, compare mature cohorts on reach, elapsed distribution and downstream paid/retained outcomes. A faster path that reduces eventual value is not an improvement.
Design an experiment
Suppose the hypothesis is that requiring a second data source before rendering any report delays value.
Control: require both sources during onboarding.
Treatment: render a useful first report from one source and prompt for the second later.
Primary metric: first-value reach within 24 hours among eligible accounts.
Secondary: median and 75th-percentile time to value.
Guardrails: data completeness, support contacts, paid conversion and week-one retained value.
Assign variants before the relevant experience, preserve identity and wait until cohorts mature. Do not choose the treatment merely because onboarding completion increased.
Instrumentation checks
- The eligible start fires once.
- The first-value event fires only after successful completion.
- Server/client timestamps use a consistent standard.
- Retries do not create a new first value.
- Account merges preserve the earliest valid start and value according to policy.
- Internal, sandbox and migrated accounts are excluded.
- Recent accounts are marked incomplete.
- Event-definition changes are annotated.
If time to value suddenly improves after a release, check the instrumentation before celebrating.
Connect time to value to the founder report
The weekly page should show eligible mature accounts, first-value reach, median/upper percentile and the largest elapsed segment. Link to the activation funnel for diagnosis. Keep raw event exploration in the product source.
Find where your activation funnel leaks explains how to locate the first broken handoff before changing the product.
Frequently asked questions
Is onboarding completion still useful?
Yes, as an intermediate diagnostic. It should not substitute for the completed value outcome.
What if value is subjective?
Choose the closest observable completed outcome, state its limits and validate it against customer research and retained behaviour.
When should the clock start?
At a consistent eligible event that fairly begins the journey. Account creation is common, but product architecture may require another point.
What about accounts that never activate?
Include them in first-value reach and report them separately. They do not receive a time-to-value duration unless using survival-analysis methods.
Should I optimize the median or the tail?
Use reach plus distribution. The median describes the typical success; the tail often identifies a segment-specific problem.
Sources
- Founder tracking time to first value
- Founder measuring time to the aha moment
- Onboarding completed without the core workout