Article · Updated August 2026
App analytics and ASO tools compared
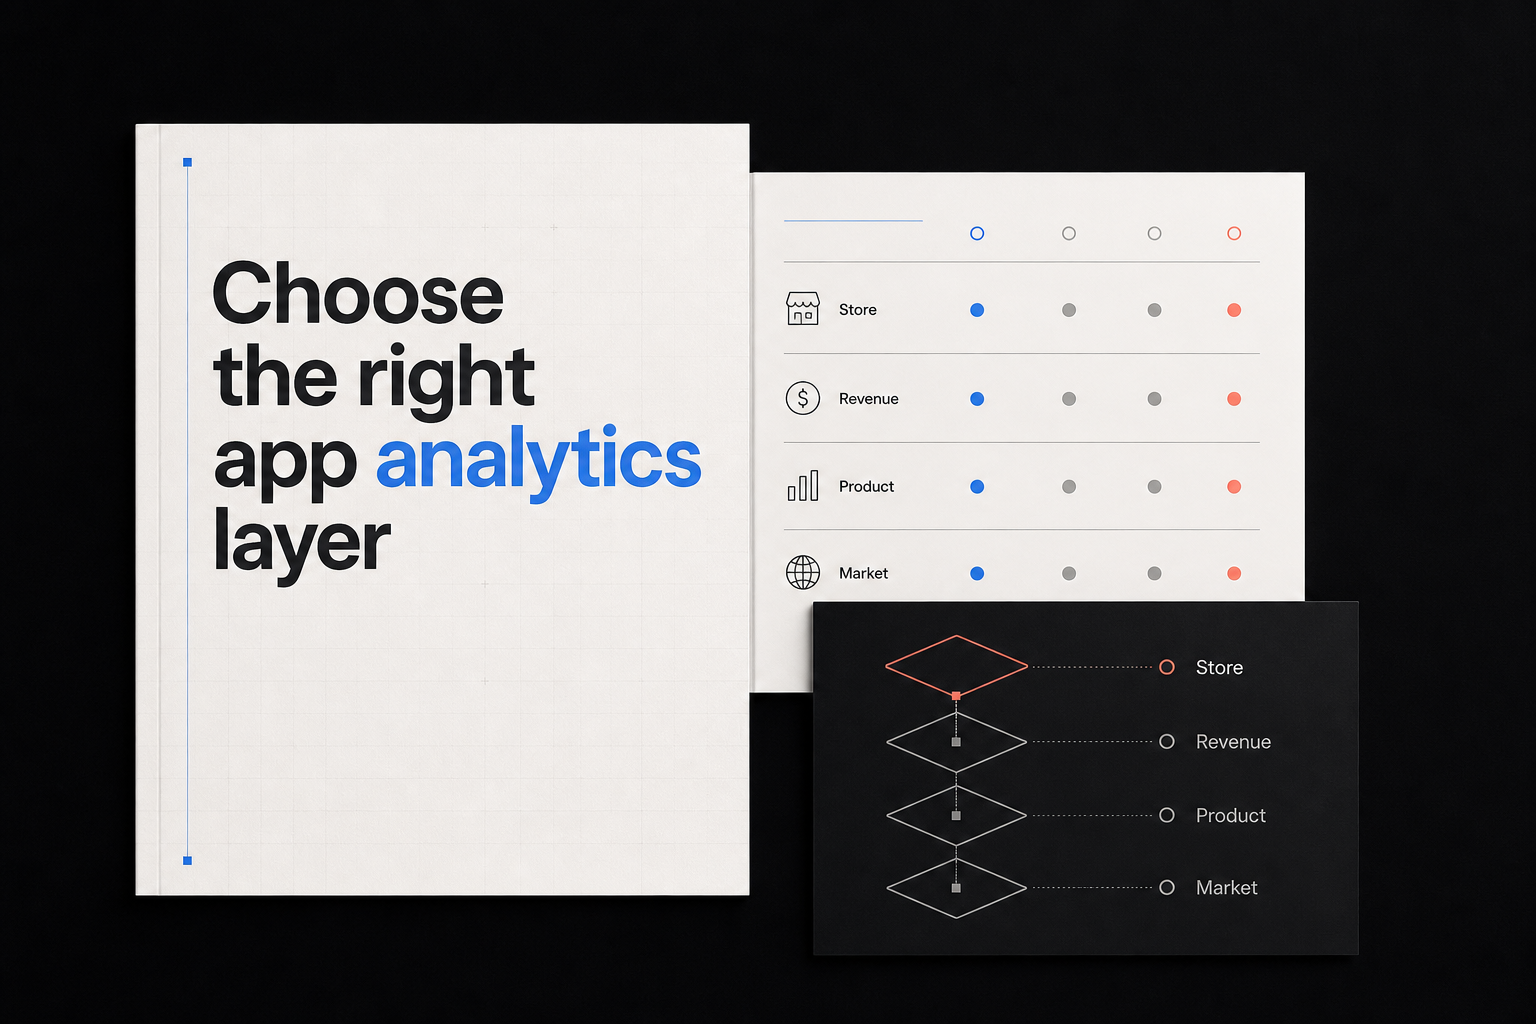
App analytics and app store optimization tools overlap at the edges, but they do not answer the same question. App Store Connect explains your app’s performance inside Apple’s store. A subscription platform explains customer entitlement and recurring revenue. Product analytics explains what measured users do in the product. An ASO platform adds keyword, competitor and market intelligence.
The right tool is the one that owns the missing evidence. Buying all four does not repair a broken identity join or an undefined first-value event.
MetricsJar publishes this comparison and sells a cross-source founder-reporting layer. That bias is explicit. MetricsJar is useful when the sources already exist and the recurring job is reading their top-line signals together. It is not a replacement for keyword intelligence, event exploration or subscription infrastructure.
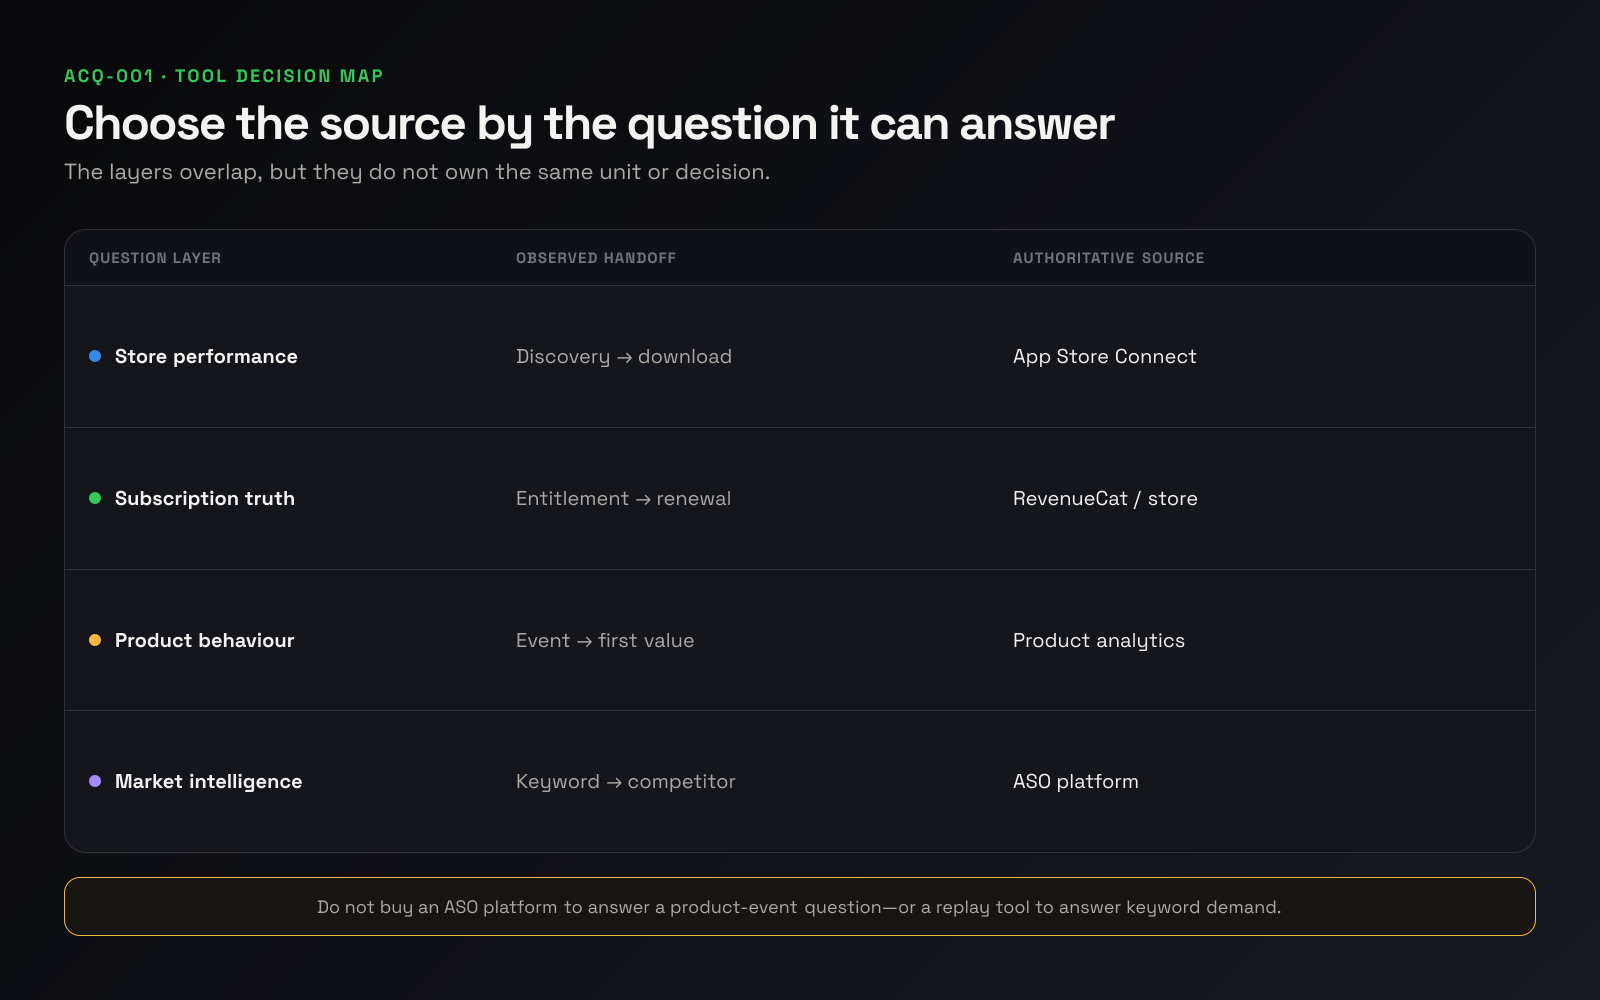
The four jobs are different
| Job | Example question | Source layer | Unit to preserve |
|---|---|---|---|
| Store performance | Did product-page views become first-time downloads? | App Store Connect | Impression, product-page view, download or device |
| Subscription truth | Did a trial become an active paid entitlement? | RevenueCat or store subscription data | Customer, entitlement, transaction or subscription |
| Product behaviour | Did a new account reach first value? | Product analytics | Event, user, account or session |
| Market intelligence and ASO | Which keywords or competitors deserve attention? | ASO platform | Keyword, rank, country, competitor or estimate |
Start by writing the question in one sentence. If it contains “keyword,” “competitor” or “category opportunity,” it is probably an ASO intelligence job. If it contains “what did this user do?”, it is a product-analytics job. If it contains “is this customer entitled?”, it belongs to subscription infrastructure.
Native App Store Connect analytics
Apple says App Store Connect Analytics covers acquisition, engagement, monetization, retention and quality, with interactive views and bulk reports available through the API (Apple). Analytics is included with Apple Developer Program membership and requires no additional technical implementation (Apple).
For acquisition, Apple exposes sources including App Store search, App Store browse, app referrer, web referrer and custom campaigns. It can connect a recorded download source to subsequent sales, usage and subscriptions, although a manual redownload resets the source attribution (Apple).
Use it when you need first-party answers about:
- impressions and unique impressions;
- product-page views;
- first-time downloads, redownloads and total downloads;
- store conversion rate;
- source type, territory and device;
- Apple-defined subscription and retention metrics.
The boundaries matter. Apple’s usage data depends on users opting in to share analytics, and the dashboard suppresses some data until privacy thresholds are met. Its conversion rate divides total downloads and pre-orders by unique-device impressions. That is not the same as product-page-view conversion, account activation or paid conversion.
Best fit: first-party store performance and Apple-attributed acquisition.
Poor fit: competitor keyword research, unrestricted product-event exploration or a cross-platform subscription ledger.
RevenueCat and subscription analytics
RevenueCat is subscription infrastructure with charts and analytics around customers, entitlements, transactions and recurring revenue. Its current pricing page says the product is free to start and prices by active subscriptions monitored rather than feature gates (RevenueCat). Check the live page before buying because pricing can change.
Use a subscription layer when the question is:
- Is this customer in a trial, active, cancelled, expired or in grace period?
- Which transaction created or renewed the entitlement?
- How did trial, renewal, cancellation and refund state change?
- What does normalized recurring revenue look like across store plans?
RevenueCat and App Store Connect can both display revenue-related metrics while using different calculations, observation rules or customer entities. A founder asking whether RevenueCat is “accurate compared with App Store” may be comparing two valid measures with different definitions. Preserve the metric name, revenue basis, time window and currency before treating the mismatch as an error.
Best fit: cross-platform subscription state, entitlements and subscription lifecycle.
Poor fit: organic keyword demand, competitor research or detailed non-subscription product behaviour.
Product analytics
Product analytics begins after a measured user enters the product. It is the right layer when the blocked question depends on events, identities, funnels, paths, cohorts or feature use.
PostHog, for example, offers product analytics and session replay alongside other products, with usage-based pricing and free allowances published on its pricing page (PostHog). The category is broader than one vendor: the important requirement is an event plan and an identity model that match the decision.
Use product analytics when you need to know:
- whether an eligible account completed the first-value event;
- where a measured funnel loses accounts;
- which features retained cohorts use;
- which observed behaviour to inspect with replay;
- how one segment behaves differently from another.
Instrumentation creates both power and responsibility. An event that fires twice, changes meaning or never joins to an account can make a sophisticated funnel less trustworthy than a simple source count. Start with entry, first value, commercial and return events. Add more only for recurring decisions.
Best fit: behavioural diagnosis and repeated event-based questions.
Poor fit: authoritative App Store downloads, subscription entitlement or external keyword intelligence.
ASO intelligence platforms
ASO platforms add market data that your own store account cannot provide. The category commonly includes keyword tracking, competitor monitoring, download or revenue estimates, creative history, reviews and market reports.
Two examples illustrate the range:
- Appfigures currently lists a free Starter option, a Connect plan at $9.99/month on monthly billing, Monitor at $44.99/month and higher tiers for deeper ASO and app intelligence. The pricing page separates connected-app analytics from keyword and market intelligence (Appfigures).
- AppTweak currently lists its Essential ASO plan at $79/month billed annually, with 500 tracked keywords, one seat and six months of historical data; higher plans add more keywords, history and features (AppTweak).
Prices and packaging were checked on 12 August 2026 and can change. Compare the live plan against the exact job, country coverage, historical window and number of tracked apps you require.
Use an ASO platform when you need to:
- discover and monitor relevant keywords;
- compare ranking movement by country;
- inspect competitor metadata or creative changes;
- estimate market or competitor performance with disclosed limitations;
- manage review or store-optimization workflows.
Estimates are not your first-party store ledger. Keep estimated competitor downloads separate from your own App Store Connect downloads, even when both appear in one interface.
Best fit: keyword, competitor and market decisions.
Poor fit: product-event truth, customer entitlement or a fixed founder operating brief.
Cross-source founder reporting
A founder-reporting layer sits above the sources. It is useful when the question is not “which keyword should we target?” but “can I see acquisition, activation and recurring revenue in one recurring view?”
MetricsJar is designed for that layer. It keeps source metrics visible together, preserves their definitions and reduces repeated dashboard assembly. The current offer is one complete hosted dashboard free; paid plans are $40/month or $400/year for unlimited dashboards. Connected provider credentials are encrypted and can be revoked from Data health. MetricsJar does not promise deep ad hoc analysis, ASO intelligence or unrestricted event exploration.
Best fit: recurring multi-source founder review across existing systems.
Poor fit: replacing the authoritative source or solving a missing instrumentation problem.
Comparison table
Current public facts were checked on 12 August 2026.
| Option | First-party store data | Subscription state | Product events | Keyword/competitor intelligence | Cross-source recurring view | Public starting point |
|---|---|---|---|---|---|---|
| App Store Connect | Strong for Apple | Apple-defined subscription views | Limited Apple usage measures | No external competitor intelligence | Apple ecosystem only | Included with Apple Developer Program |
| RevenueCat | Receives store transaction context | Strong | Commercial events and integrations, not a general event explorer | No | Subscription-focused | Free to start; usage basis published live |
| Product analytics | Only if imported/instrumented | Only if integrated | Strong | No | Behaviour-focused | Vendor and event-volume dependent |
| Appfigures | Connected-app analytics | Subscription analytics listed | Limited compared with dedicated product analytics | Stronger on higher ASO/intelligence tiers | App/store-focused | Free Starter; paid plans from $9.99/month monthly |
| AppTweak | Console and reporting integrations | Depends on integration | Not its primary job | Strong | App-growth reporting | Essential $79/month billed annually |
| MetricsJar | Connected source view | Connected source view | Top-line events where connected | No | Strong for a fixed founder brief | One dashboard free; hosted unlimited $40/month |
No row is a universal winner. The columns are different jobs.
A practical decision sequence
If downloads are the problem
Begin in App Store Connect. Separate impressions, product-page views, first-time downloads and redownloads. Segment by source, territory and device. Add an ASO platform only when you need external keyword or competitor evidence.
If paid conversion is the problem
Begin with the subscription source. Define trial eligibility and allow cohorts enough time to convert. Add product analytics when you need to observe the events before the paywall or trial decision.
If activation is the problem
Begin with product instrumentation. Define the first-value event and stable account identity. Store downloads and ASO ranks are context, not the activation denominator.
If reporting work is the problem
Keep the existing sources. Write down the recurring questions, align the reporting window and choose a thin reporting layer. Do not buy market intelligence because four dashboards are annoying to open.
Worked example: an iOS subscription app
Acme Coach has 40,000 monthly App Store impressions, 2,800 product-page views, 900 first-time downloads, 420 accounts, 160 first-value completions and 35 mature trial conversions. Those numbers come from different layers.
| Question | Correct starting source | Why |
|---|---|---|
| Did store conversion change? | App Store Connect | It owns unique impressions and downloads |
| Which keyword deserves a test? | ASO platform | It adds external demand and competitor context |
| Why did 260 accounts fail to reach value? | Product analytics and replay | It can inspect event paths and observed friction |
| Are 35 customers entitled and renewing? | RevenueCat/store subscription source | It owns lifecycle and transaction state |
| Can the founder review all four weekly? | Founder-reporting layer | It keeps the source signals in one operating view |
The stack can contain all layers eventually. It should not begin there. Add the next one only when its question recurs and its output changes a decision.
Frequently asked questions
Is App Store Connect enough for app analytics?
It is enough for many first-party App Store, acquisition and Apple-defined subscription questions. It is not external ASO intelligence or an unrestricted product-event system.
Is RevenueCat more accurate than App Store Connect?
That framing is usually too broad. Compare the exact metric, entity, time window, currency and revenue basis. Both systems can be correct while answering different questions.
Do I need both product analytics and session replay?
Only when both jobs recur. Product analytics locates a measured pattern; replay can help observe what happened in selected sessions. Replay does not repair missing or ambiguous events.
When is an ASO subscription worth paying for?
When keyword, competitor or market decisions recur often enough to justify the plan and someone owns the resulting experiments. Occasional first-party store checks do not require a full ASO platform.
Can one dashboard combine all the numbers?
Yes, but it should preserve each source’s unit and definition. Putting the values together does not make an impression, device, account and customer interchangeable.
Sources
- Apple App Store Connect Analytics overview
- Apple acquisition sources and funnel metrics
- Apple App Store Connect metric definitions
- RevenueCat pricing
- PostHog pricing
- Appfigures pricing
- AppTweak pricing
- Discussion about ad spend versus customer value
- Discussion after 100,000 downloads
- Discussion comparing RevenueCat and App Store reporting